
Short answer (two ways to read “leading”)
- By total R&D dollars spent (largest budgets): the United States is the largest R&D performer, followed by China, Japan, Germany, South Korea, the United Kingdom, France, Taiwan, and then countries such as India, Canada and Italy among the next tier depending on the data year and exchange/PPP method. (US R&D in the high hundreds of billions; China approaching similar scale). National Science Foundation+1
- By R&D intensity (R&D spend as % of GDP): smaller advanced economies top the list — Israel, South Korea, Sweden, Switzerland, and Taiwan are among the highest in R&D/GDP, with many OECD averages around ~2.5–2.8% of GDP. Visual Capitalist+1
Important: R&D statistics are reported in different ways (current USD, PPP-adjusted USD, and R&D as % of GDP) and there can be a lag in official releases. When I cite a dollar figure I indicate the relevant reporting period (usually 2022 or 2023) and the source.
Top ten (expanded) — who and why
A. Top R&D spenders by total dollars (big picture)
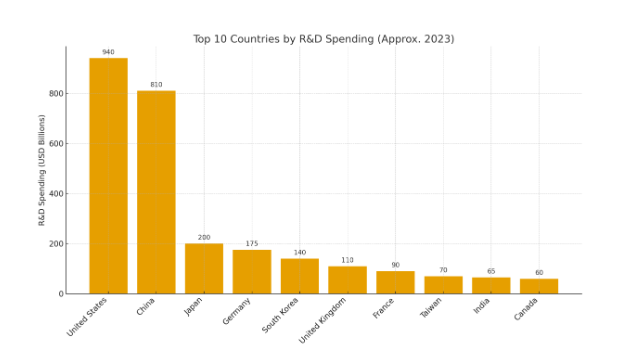
Using recent national statistics and international syntheses (NSF, OECD, UNESCO, etc.), the following economies are consistently the largest R&D performers by total spending (ordered roughly by size in the most recent comparable tallies):
- United States — roughly $800–940 billion in total R&D (estimates vary by year; NSF reported $892B in 2022 with estimates near ~$940B for 2023). The U.S. leads because of large corporate R&D (Big Tech, pharma, defense contractors) plus major university and federal research spending. National Science Foundation+1
- China — roughly $700–810+ billion (rapid growth; China’s GERD advanced strongly and in several international series approaches the U.S. scale on current-dollar or PPP bases). China’s fast growth is driven by big private and state-backed investments and massive patent output. National Science Foundation+1
- Japan — ~$200B. Strong corporate R&D in electronics, auto, materials, and life sciences. National Science Foundation
- Germany — ~$170–175B. Long tradition of industrial R&D (automotive, manufacturing, industrial equipment). National Science Foundation
- South Korea — ~$130–140B and very high R&D intensity (big private investment from conglomerates like Samsung, LG, Hyundai). National Science Foundation+1
- United Kingdom — ~$100–110B (strong life-sciences and AI research ecosystems). National Science Foundation
- France — ~$80–90B. National Science Foundation
- Taiwan (economy) — ~$60–70B (very concentrated in semiconductors and electronics: TSMC, hardware suppliers). National Science Foundation
9–10. India, Canada (and/or Italy, Spain depending on the year and PPP conversions) — these countries fall into the next tier by absolute dollars; India is rapidly increasing its R&D base but still has lower business R&D share compared with OECD norms. Department of Science & Technology+1
Why two lists matter: Large economies (US, China) dominate the raw dollar totals, while small/high-tech economies (Israel, South Korea, Sweden) can invest far more relative to the size of their economies.
B. Top countries by R&D intensity (R&D as % of GDP)
A different, insightful ranking measures how much of its economic output a country devotes to R&D (useful to see national priority):
- Israel, South Korea, Sweden, Switzerland, Taiwan, Japan, Austria, Germany, Finland — these countries frequently appear near the top in R&D/GDP (Israel and South Korea are notable leaders on this metric). OECD/UNESCO dashboards and VisualCapitalist summaries document these patterns. High intensity usually correlates with deep private sector R&D (electronics, biotech, defense, advanced manufacturing). Visual Capitalist+1
Who are the top corporate R&D spenders (the private engine of innovation)?
Large corporate R&D budgets concentrate in Big Tech, pharmaceuticals, and the auto sector. Recent corporate R&D leader lists (Global Innovation 1000, RDWorld, VisualCapitalist) show:
- Alphabet (Google), Meta, Apple, Microsoft, Amazon — huge annual R&D budgets (tens of billions each). These firms drive AI, cloud, software, and hardware research. RD World Online+1
- Samsung Electronics, Huawei, Intel, TSMC — big R&D in semiconductors, hardware and components. Wikipedia+1
- Major pharma & biotech (Roche, Johnson & Johnson, Pfizer, Merck, Novartis) — heavy R&D in drugs, biologics, vaccines. Wikipedia
- Automotive groups (Volkswagen, Toyota, GM) increasingly rank among the biggest R&D spenders due to electrification and autonomous vehicle research. Wikipedia
(Company rankings vary year-to-year; for example Amazon’s R&D line item is very large because R&D is the corporate category that captures product, AWS, and other investments — lists from 2023–2024 show Alphabet, Meta, Apple, Microsoft among the top R&D spenders). Wikipedia+1
Which countries & companies are leading in the latest technologies?
I’ll break this into the major modern tech areas and name the current leaders and why.
1. Artificial Intelligence (AI)
- United States leads in AI in terms of: private AI investment, major AI labs (OpenAI, Anthropic, Google DeepMind), cloud compute, venture capital, and an ecosystem that moves models to products at scale. Stanford and other rankings place the U.S. top for private AI investment and ecosystem strength. AP News+1
- China is a close second on research publications and patenting activity and has a huge domestic AI market and state-backed initiatives that accelerate deployment. China’s government and private sector are quickly expanding AI R&D and applications. Reuters
- Who spends the most on corporate AI R&D: Big Tech (Alphabet, Microsoft, Amazon, Meta), and chip-accelerator firms (Nvidia, AMD), which invest heavily in model development, infrastructure, and specialized hardware. RD World Online+1
2. Semiconductors and advanced hardware
- Taiwan (TSMC) and South Korea (Samsung) are global leaders in advanced logic/leading-node chip manufacturing and R&D into process nodes, packaging, and materials. US firms (Intel, AMD, Nvidia) dominate chip design and accelerator IP; the U.S. government funds semiconductor R&D via CHIPS Act investments. Visual Capitalist+1
3. Biotech / Pharmaceuticals / Health R&D
- Switzerland, United States, Germany, UK, France host many of the world’s top pharma R&D organizations (Roche, Novartis, Pfizer, Moderna, Merck, AstraZeneca). These firms and top university medical centers drive drug discovery, biologics, and vaccine R&D. Pandemic-era investments pushed health R&D to the top of corporate & national agendas. Wikipedia
4. Green energy, materials & climate tech
- R&D here is distributed: EU countries, US, China, and Japan are strong in energy-materials research (battery tech, hydrogen, grid tech). Government programs (EU Green Deal, US DOE funding, Chinese clean-energy R&D) are boosting public and private R&D. OECD and national reporting show rising government energy R&D commitments in recent years. OECD
Key trends shaping who “wins” in R&D
- Private sector dominates total R&D spending. In most advanced economies the business sector funds the majority of R&D (corporate labs, product R&D). That’s why countries with large global tech firms (US, China, Korea, Japan) register huge R&D totals. OECD+1
- Concentration and scale matter. A handful of mega firms (Big Tech, top pharmas, major auto groups) contribute a large share of global corporate R&D. Their strategic choices — e.g., AI model scale, chip fabs, or vaccine platforms — quickly reshape national innovation footprints. Wikipedia+1
- China’s fast climb. China has rapidly increased R&D, patenting, and publication output; it entered the UN Global Innovation Index top-10 (2025) for the first time, reflecting rapid scale-up. That said, the U.S. remains dominant in certain domains (AI ecosystem, venture capital, and leading universities). Reuters+1
- Shifts in geography of strategic techs. Semiconductors and supply-chain considerations (CHIPS Act, subsidies) have made R&D geography a policy priority — governments now actively subsidize domestic R&D and scale-up in critical areas like chips, AI compute, and climate tech. Investopedia+1
Quick numeric summary (snapshot numbers & sources)
- Global R&D: total global R&D exceeded roughly $2.7–3.1 trillion in recent years (different sources and PPP vs current USD conversions). WIPO+1
- United States: ~$892B in 2022; estimated ~$940B in 2023 (NSF estimates). National Science Foundation+1
- China: ~$780–812B (2022/2023 series; rapid growth—OECD/NSF/OECD commentary). National Science Foundation+1
- Top corporate R&D budgets (examples): Alphabet, Meta, Apple, Microsoft, Amazon — each spends tens of billions annually; Amazon’s 2022 R&D listed at very large figures in earlier 2022 lists and rankings shift by year. For consolidated lists of corporate spenders see the corporate R&D rankings. Wikipedia+1
What this means for the future of “latest technology”
- AI: expect continued concentration of cutting-edge model development in U.S. corporate labs and China’s large ecosystem of researchers and deployers — but scale of compute + data + deployment will determine commercial leadership. Investment in chips (accelerators) and cloud compute is the critical enabler. AP News+1
- Semiconductors: national strategies (subsidies, domestic fabs, R&D tax credits) are reshaping capacity and geopolitics. Taiwan and South Korea remain central to advanced manufacturing while the U.S. and EU push to onshore critical capabilities. Visual Capitalist+1
- Biotech: major pharma and a few well-funded startups will continue to drive breakthroughs, but public research and university clusters remain essential for long pipeline science. Wikipedia
- Climate / green tech: cross-sector public funding and public-private partnerships will increasingly decide which countries capture new supply chains (batteries, electrolyzers, advanced materials). OECD
Caveats & how to interpret these rankings
- Different measures, different leaders. Raw dollars favor large economies; percent-of-GDP favors small, innovation-intensive economies. Company lists change year to year (accounting differences, one-off projects). I used recent OECD/NSF/VisualCapitalist/industry lists to combine perspectives. OECD+2National Science Foundation+2
- Timeliness. National data commonly publish with a lag (2022–2023 are the most complete recent years); corporate annual reports can give more current (yearly) snapshots. Where possible I used 2022–2024 releases and recent 2025 analyses. National Science Foundation+1
Short conclusions (actionable takeaways)
- United States and China are the two giants in absolute R&D dollars; the U.S. retains strength in AI ecosystems and corporate research, China is rapidly catching up in scale, patents, and deployments. National Science Foundation+1
- South Korea, Taiwan, Japan, Germany remain crucial because they combine high corporate R&D intensity and world-class industrial capabilities (especially in semiconductors, electronics, and automotive). National Science Foundation+1
- Big corporate R&D (Big Tech, pharmas, auto groups) drives much of the leading applied research in AI, biotech, semiconductors and clean energy. Tracking the top corporate R&D budgets gives a good signal of where applied breakthroughs and productization will appear next.


Be First to Comment