
Inflation — the gradual erosion of purchasing power — is among the most disruptive forces a government must manage. It affects whether citizens can afford food, housing, and healthcare. It determines whether a pensioner's savings retain value or evaporate. It shapes the cost of borrowing, the return on investment, and the competitiveness of a nation's exports. At the centre of all these calculations sits the Consumer Price Index, universally known as the CPI.
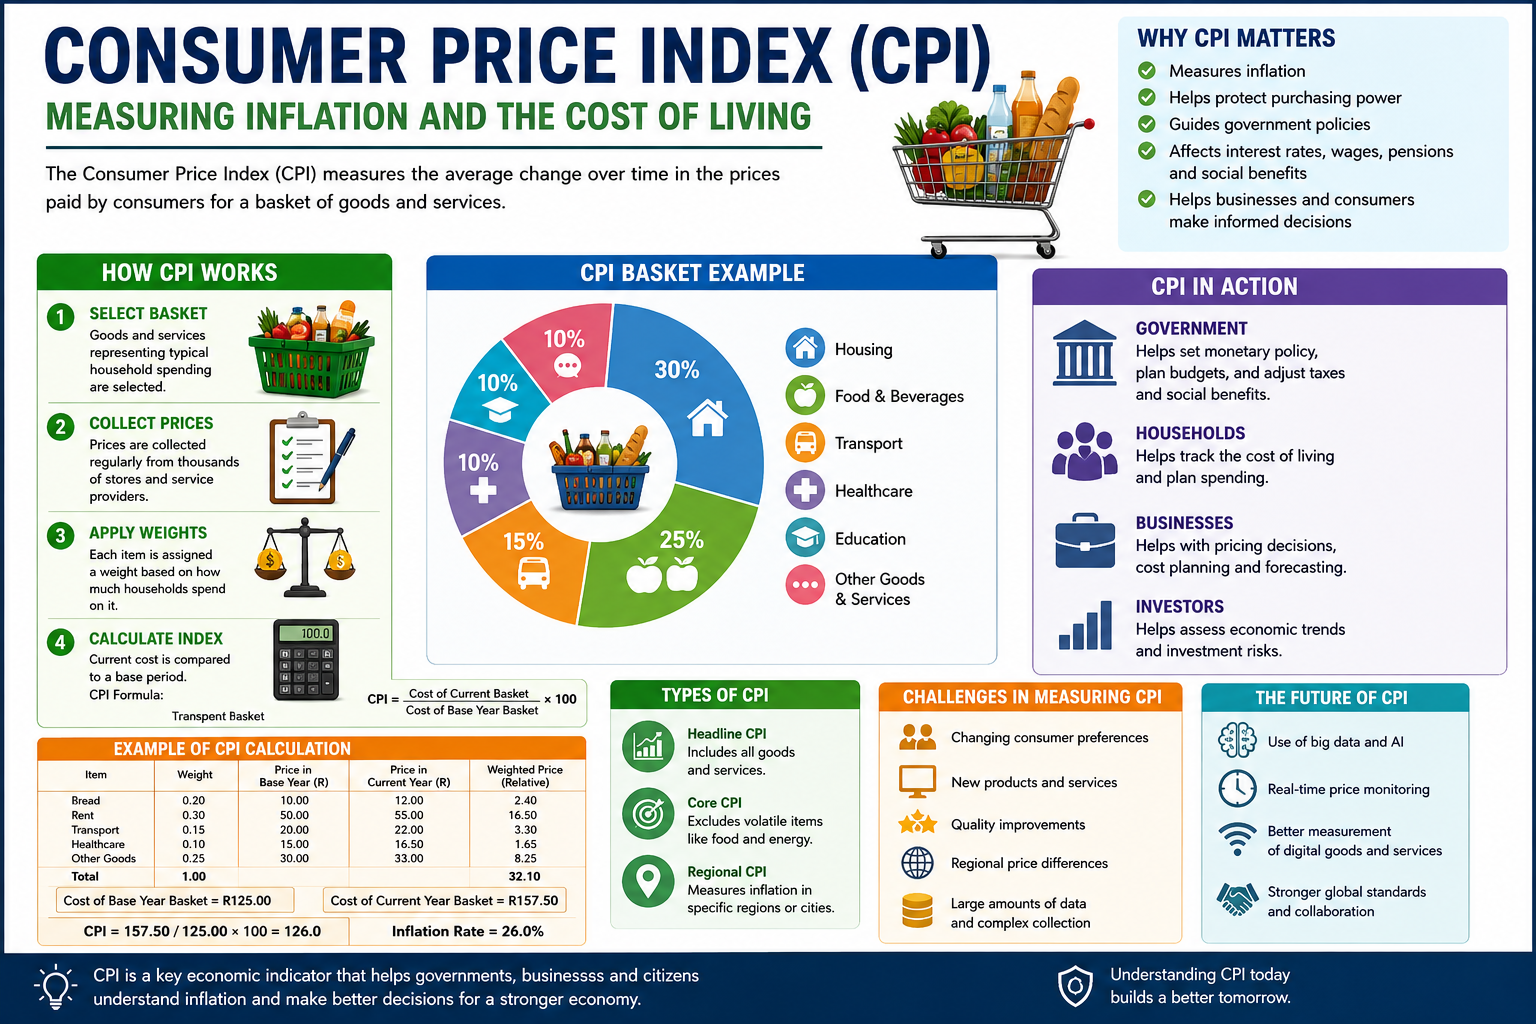
In its simplest form, the CPI measures how much a representative "basket" of goods and services costs over time. If the basket cost 1,000 currency units last year and costs 1,050 today, the CPI has risen by 5% — meaning inflation is 5%. Simple in concept, yet profoundly complex in execution and application, the CPI is simultaneously a measurement tool, a policy instrument, and a mirror of social priorities.
For governments, the CPI is not just data — it is governance infrastructure. Central banks adjust interest rates based on CPI readings. Finance ministries calibrate social grants, pension adjustments, and tax brackets against CPI movements. Labour tribunals use CPI data to arbitrate wage disputes. International lenders assess sovereign risk partly through CPI trends. In short, the CPI is everywhere in modern institutional life, even when it is invisible to the public eye.“
“The CPI is not merely a number. It is the language in which governments speak about the cost of living — and the standard by which citizens hold institutions accountable.”
"


This essay unpacks all dimensions of the CPI — how it is built, who uses it, what it reveals, and where it falls short — to offer readers a complete, nuanced understanding of this indispensable economic instrument.


◆ ◆ ◆
The idea of measuring price levels is ancient — merchants and rulers have tracked commodity prices for millennia. However, the formalised CPI as a government statistical instrument emerged in the early 20th century, driven largely by wartime economic disruption and labour unrest.
During the First World War (1914–1918), rapidly rising food and housing costs sparked strikes and social instability in the United States and United Kingdom. Governments urgently needed a reliable way to measure price changes to inform wage adjustments and ration policies. The U.S. Bureau of Labor Statistics began publishing the first modern CPI in 1919, using expenditure surveys to construct a representative cost-of-living index for working-class urban households.
Over the following decades, CPI methodology evolved significantly. The Great Depression of the 1930s exposed the limitations of early price indices that failed to account for consumer substitution and quality changes. Post-World War II reconstruction and the creation of the Bretton Woods institutions brought renewed global interest in standardised inflation measurement. The IMF and the ILO began promoting harmonised CPI methodologies to enable cross-country comparison and facilitate international lending.
By the 1970s, the stagflation crisis — simultaneously high inflation and high unemployment — placed central bank inflation targets and CPI measurement at the heart of macroeconomic policy debate. The ILO published its first comprehensive CPI manual in 2004, providing a globally referenced methodological framework that most national statistics offices now use as their foundation.[NOTE]
Historical Milestone
The United States CPI has been calculated continuously since 1913, making it one of the longest uninterrupted economic time series in the world. Over more than a century, it has survived two World Wars, the Great Depression, the Cold War, the Digital Revolution, and the COVID-19 pandemic — each of which significantly reshaped what households consume and how prices are measured.
In Africa, CPI measurement gained institutional momentum post-independence as new national statistics offices were established in the 1960s and 1970s. South Africa's Statistics South Africa (Stats SA) has published the CPI since the early 20th century, with significant methodological upgrades in 2008 and 2017 to align with international standards.


◆ ◆ ◆
Understanding how the CPI is built is essential to appreciating both its power and its limitations. The construction process involves several key steps, each involving decisions that ultimately determine what the index measures and how accurately it reflects real-world price changes.3.1 Defining the Reference Population
Every CPI is constructed for a specific population of consumers. Most national CPIs target "urban households" or "all private households." Some countries produce multiple CPIs — the United States produces both a CPI for All Urban Consumers (CPI-U) and one for Urban Wage Earners and Clerical Workers (CPI-W). The choice of reference population has profound implications: a CPI targeting urban middle-class households will measure inflation very differently from one targeting rural or low-income households.3.2 Constructing the Basket of Goods and Services
The CPI basket represents the typical spending pattern of the reference population, derived from large-scale household income and expenditure surveys (HIES). From this data, statisticians determine what proportions of income are spent on food, housing, transport, healthcare, education, recreation, and other categories.


        CPI Category
        South Africa
        USA
        Kenya


      Food & Non-Alcoholic Beverages    17.2%   13.4%   36.0%

      Housing, Water & Electricity    24.5%   42.4%   18.5%

      Transport    14.3%   16.9%   9.2%

      Health & Medical    4.2%    8.9%    3.5%

      Education    3.0%    6.9%    4.0%

      Clothing & Footwear    3.9%    2.7%    6.5%

      Miscellaneous / Other    32.9%   8.8%    22.3%


    Indicative CPI basket weights by country — illustrating how spending priorities shape inflation measurement


The table above illustrates how dramatically basket weights differ across countries. In Kenya, food accounts for 36% of the CPI basket — reflecting the large share of income poorer households allocate to basic nutrition. In the United States, housing dominates at over 42%. These differences mean that a global oil price spike may push South African transport-driven inflation upward while registering more mildly elsewhere.
3.3 Price Data Collection
Each month, trained price collectors visit thousands of retail outlets, service providers, and online platforms to record prices. Modern statistical agencies also increasingly use scanner data from supermarkets and web-scraping technologies to capture price changes with greater speed and precision. In countries with large informal economies, capturing prices in informal markets remains a persistent methodological challenge.3.4 Index Calculation
Once price data is collected, statisticians calculate price relatives (the ratio of current to base period prices) for each item, then aggregate these using expenditure weights to produce the overall index. The most widely used formula is the Laspeyres index, which uses base-period weights. Most national CPIs use variants of this approach for its simplicity and consistency over time.[NOTE]
How the Index Number Works
If a basket of goods costs R1,000 in the base year (index = 100) and R1,082 in the current year, the CPI is 108.2. The inflation rate is therefore 8.2%. This seemingly simple calculation involves prices for hundreds of individual items, weighted by their share in household expenditure, and collected from thousands of survey points every month.
◆ ◆ ◆Not all CPIs measure the same thing. Different variants have been developed for specific institutional and policy purposes, which is why different reports may cite different inflation figures for the same country at the same time.
Headline CPI is the most widely reported measure — total price change across the full basket, including food and energy. It is the figure reported in news headlines and used as the basis for monetary policy by most central banks, though it can be volatile due to food and energy price fluctuations.
Core CPI excludes food and energy to provide a more stable measure of underlying inflationary pressures. It is favoured by central banks when making medium-term decisions, as it filters out temporary price shocks. The U.S. Federal Reserve and the European Central Bank (ECB) explicitly reference core metrics in their policy communications.
The Producer Price Index (PPI) measures prices received by producers rather than paid by consumers. PPI typically leads CPI by several months — when production costs rise, firms eventually pass these on to consumers, making PPI a useful leading indicator.
The Harmonised Index of Consumer Prices (HICP), used by the European Union, allows direct comparisons across EU member states using standardised Eurostat methodology. It is the reference measure for the ECB's 2% inflation target and is fundamental to the architecture of the eurozone.
The Personal Consumption Expenditures (PCE) Deflator is the U.S. Federal Reserve's preferred inflation measure. It has broader coverage than the CPI, uses chain-weighting to better account for consumer substitution, and is less prone to shelter cost estimation biases. The Fed's 2% inflation target is stated in PCE terms — a distinction with significant policy implications.
◆ ◆ ◆The relationship between the CPI and central banking is perhaps the most consequential application of inflation measurement in modern governance. Most central banks operate under an "inflation targeting" framework — formally adopted by New Zealand in 1990 and since embraced by dozens of countries including South Africa, Canada, Brazil, and the United Kingdom.
When monthly CPI data shows inflation rising above the target band, the central bank typically raises its policy interest rate. Higher rates increase the cost of borrowing throughout the economy — mortgages, business loans, car finance, and credit cards all become more expensive. This dampens spending, reduces demand, and over time brings inflation down. Conversely, when CPI indicates inflation is falling below target, the central bank may lower rates to stimulate growth.
Country
Central Bank
CPI Target
Policy Rate (2025)
Recent CPI
South Africa SARB 3%–6% 7.50% 5.2%
United States Federal Reserve ~2% (PCE) 4.25%–4.50% 3.0%
Eurozone ECB 2% 3.15% 2.4%
United Kingdom Bank of England 2% 4.75% 2.6%
Kenya Central Bank of Kenya 5% ± 2.5% 12.00% 4.5%
Brazil Banco Central 3% ± 1.5% 13.75% 4.8%
Selected central bank inflation targets and policy rates, 2025
The release of monthly CPI data is one of the most watched events in global financial markets. A CPI reading higher than market expectations typically triggers immediate reactions: stock markets may fall, bond yields rise, and currencies shift in anticipation of rate changes. In 2022, U.S. CPI peaked at 9.1% — the highest in 40 years — triggering the most aggressive Federal Reserve rate hike cycle in decades, reshaping global capital flows and increasing debt service costs across the developing world.
◆ ◆ ◆Beyond monetary policy, the CPI is embedded throughout the machinery of government fiscal management — the processes by which governments raise revenue, allocate spending, and manage public debt. Understanding these applications reveals the CPI as governance infrastructure with direct implications for budget outcomes and citizen welfare.6.1 Social Grant and Pension Indexation
One of the most socially significant applications of the CPI is the adjustment of social protection payments. Governments worldwide index pensions, disability grants, child support grants, and other social transfers to the CPI to ensure that beneficiaries do not experience a decline in real living standards as prices rise. In South Africa, SASSA adjusts all social grants annually in line with inflation estimates, protecting approximately 18 million grant recipients. In the United States, the 2023 Social Security Cost-of-Living Adjustment (COLA) was 8.7% — the largest increase in over 40 years — directly reflecting the 2022 inflation surge.6.2 Tax Bracket Indexation
Many countries index personal income tax brackets to the CPI to prevent "bracket creep" — where wage inflation pushes workers into higher tax brackets even though their real income has not increased. Without indexation, inflation effectively functions as a stealth tax increase. Countries including the United States, Canada, Germany, and South Africa adjust tax thresholds annually using CPI data.6.3 Inflation-Linked Government Bonds
Governments also use CPI as the basis for inflation-linked securities. South Africa's Inflation-Linked Bonds (ILBs), the UK's Index-Linked Gilts, and the USA's Treasury Inflation-Protected Securities (TIPS) all have their principal and coupon payments adjusted in line with CPI movements. These instruments allow governments to borrow at lower nominal rates while sharing inflation risk with investors — and they depend entirely on the credibility and accuracy of official CPI measurement.[NOTE]
Fiscal Impact Example: South Africa
A 1 percentage point increase in CPI above projections raises the cost of social grants paid to 18 million beneficiaries, adjusts public sector wage bill expectations, raises interest payments on inflation-linked bonds in the R2 trillion sovereign debt portfolio, and reduces the real value of tax revenues if thresholds are unadjusted. Accurate CPI measurement is therefore not just a statistical matter — it is a fiscal governance priority.
◆ ◆ ◆The relationship between the CPI and wages sits at the intersection of economics, law, and social justice. In both the private and public sectors, the CPI is the single most referenced indicator in wage negotiations, playing a defining role in determining whether workers' real incomes rise, stagnate, or decline.
A central concept in labour economics is the distinction between nominal wages (the actual monetary amount earned) and real wages (what that amount can actually buy after adjusting for inflation). A 6% pay increase is meaningless if CPI inflation is 8% — in real terms, the worker is 2% poorer. CPI is therefore the reference point against which any nominal wage increase must be evaluated.
Trade unions and employer organisations across the world use CPI data as a starting point in collective bargaining. Wage demands are typically framed as "CPI plus x percent" — with the CPI component representing the floor needed to preserve purchasing power. In South Africa, NEDLAC frequently references CPI in deliberations on minimum wages, public sector pay, and sectoral determinations. The National Minimum Wage (NMW) is reviewed annually with explicit reference to CPI movements.
For governments, the CPI's role in public sector wage negotiations carries profound fiscal consequences. When real public sector wages grow faster than CPI and GDP growth, they squeeze the fiscal space for development spending on infrastructure, education, and healthcare. South Africa has faced this tension acutely — a persistent source of industrial action in the public sector.
◆ ◆ ◆The CPI's role extends well beyond domestic policy — it is a critical tool in international development, poverty assessment, and multilateral financial governance. International institutions use CPI data to assess economic stability, measure poverty, evaluate lending risk, and calibrate development interventions.
The World Bank's international poverty lines — most famously the $2.15 per person per day extreme poverty threshold — are expressed in Purchasing Power Parity (PPP) terms, which are derived from price survey data analogous to CPI methodology. When national CPI data quality is weak, the reliability of poverty estimates is compromised. Strong national CPI systems are therefore a prerequisite for credible poverty measurement.
The IMF monitors CPI trends in all member countries as part of its annual Article IV consultation process. When countries experience acute inflation crises and seek IMF assistance, CPI stabilisation typically features prominently among programme conditions. Recent IMF programmes in Sri Lanka, Pakistan, Egypt, and Argentina have all included explicit targets for bringing CPI inflation within defined bounds as conditions for loan disbursement.[NOTE]
CPI and African Development
The African Development Bank and the African Union Commission use harmonised CPI data from member states to monitor progress on the African Continental Free Trade Area (AfCFTA), track inflation convergence criteria for proposed monetary unions, and assess macroeconomic conditions needed for regional integration. Weak CPI measurement capacity in fragile states remains one of the key data gaps challenging evidence-based policymaking on the continent.
◆ ◆ ◆Despite its central role in economic governance, the CPI is not without significant limitations. Understanding these limitations is essential for policymakers who rely on CPI data and for citizens who seek to evaluate government claims about inflation.9.1 The Substitution Bias
The Laspeyres formula assumes households continue to buy the same quantities of goods as in the base period, even as prices change. In reality, consumers substitute cheaper alternatives when specific prices rise. By assuming fixed consumption patterns, the traditional CPI overstates actual inflation experienced by consumers who adapt their behaviour. The Boskin Commission (1996) estimated this bias at approximately 0.5 to 1.5 percentage points per year in the U.S. CPI.9.2 Quality Change and New Product Biases
The CPI struggles to adequately capture quality improvements in products over time. If a laptop costs the same as a previous model but is twice as powerful, the price is effectively lower in quality-adjusted terms. Statistical agencies use hedonic pricing models to address this, but these methods are imperfect. Similarly, new products take time to enter the CPI basket, meaning early-adopter inflation experiences for novel goods are not captured.9.3 The Housing Cost Problem
Most CPIs use an "owners' equivalent rent" (OER) concept — estimating what homeowners would pay if they rented their own homes — to capture housing costs. This approach can diverge significantly from actual house prices or mortgage costs. In the United States, OER constitutes over a third of the CPI and has been a source of ongoing methodological debate about whether the CPI accurately reflects housing affordability pressures.9.4 The Distribution Problem: Whose Inflation?
Perhaps the most fundamental criticism is that the CPI measures inflation for a "representative" or "average" household — one that may not resemble any actual household. Low-income households spend much larger shares of their budgets on food and energy. When these prices spike, poorer households experience inflation significantly above the headline CPI, while wealthy households may experience below-average inflation. A single CPI figure thus masks significant distributional variation in the inflation burden.“
“The CPI speaks in averages. But people do not live in averages — they live in the specific, unequal reality that averages conceal.”
"


◆ ◆ ◆
The emergence of big data, artificial intelligence, and digital transaction records is fundamentally transforming how inflation can be measured — challenging traditional CPI methodology while offering unprecedented opportunities for more frequent, granular, and representative price data.
Scanner data and web scraping — records of every product sold at every price — provide vastly richer information than traditional monthly price collection visits can achieve. Several national statistics offices, including those of the Netherlands, Sweden, and the United Kingdom, have already integrated scanner data into their CPI production pipelines, enabling weekly or even daily updates.
Real-time inflation trackers, such as the Harvard-MIT Billion Prices Project, tracked online prices from thousands of retailers across dozens of countries on a daily basis, providing early warnings before official monthly CPI data confirmed trends. During the COVID-19 pandemic and the 2022 commodity price spike, these tools provided critical signals for policymakers.
Personalised inflation rates, using digital transaction data from credit cards and banking apps, could in principle calculate inflation for individual households based on their actual spending patterns rather than a representative basket — directly addressing the distributional critique of the CPI. Central banks and statistics offices are exploring this concept, though privacy concerns and methodological complexity remain significant obstacles.[NOTE]
The IMF on Data Innovation
The IMF has actively promoted the use of digital data sources — including scanner data, web scraping, and satellite imagery — to supplement and improve official price statistics in member countries. In its 2025 Data Standards Review, the IMF emphasised that leveraging these technologies is particularly important for low-income countries where traditional survey-based CPI collection is costly and infrequent.
◆ ◆ ◆The CPI is not merely a technical statistical artefact — it is a political and social product. How it is communicated, perceived, and trusted has profound implications for public confidence in government institutions, monetary policy credibility, and social stability.
The credibility of the CPI depends fundamentally on the institutional independence of the statistical agency that produces it. Countries including Argentina, Venezuela, and Zimbabwe have all experienced episodes where official CPI data was widely believed to understate actual inflation, severely damaging public trust and international credibility. Best practice requires that statistical agencies be operationally and financially independent from political interference, with professional statisticians making all methodological decisions free from government direction.
A persistent challenge for statistical agencies is the disconnect between official CPI measurements and the public's perception of inflation. Consumers often perceive inflation as higher than official figures suggest, partly because the prices that are most psychologically salient — food, fuel, and utilities — tend to be more volatile and often rise faster than the overall basket. Statistics offices and central banks have increasingly invested in accessible public communication strategies — including interactive personalised inflation calculators — to bridge this gap.
Political economy researchers have long studied the relationship between CPI performance and electoral outcomes. High inflation is consistently associated with voter dissatisfaction and incumbent losses — a powerful incentive for governments to prioritise inflation control. Maintaining the institutional firewall between elected governments and independent central banks is therefore crucial to avoiding politically induced inflation cycles.
◆ ◆ ◆12.1 South Africa: Inflation Targeting Under Fiscal Stress
South Africa presents a compelling case study of CPI governance under conditions of fiscal pressure, structural unemployment, and persistent inequality. The SARB has operated an inflation targeting framework since 2000, with a target band of 3% to 6%. CPI peaked above 7% in 2022 — breaching the upper target band — prompting a sustained rate hike cycle. The experience demonstrated both the power of inflation targeting as a policy anchor and its structural limits when inflation is supply-driven: higher interest rates suppress demand but cannot directly resolve energy supply constraints from Eskom or exchange rate weakness.12.2 Zimbabwe: The Collapse and Reconstruction of CPI Credibility
Zimbabwe's experience represents the most extreme cautionary tale in CPI governance. During the hyperinflationary crisis of 2007–2009, official inflation statistics became entirely detached from reality. ZIMSTAT stopped publishing CPI data in 2008 when inflation was estimated at over 500 billion percent. The abandonment of credible CPI measurement contributed to the complete breakdown of monetary trust and the eventual abandonment of the Zimbabwean dollar. The subsequent decade-long reconstruction of Zimbabwe's statistical infrastructure illustrates how fundamental reliable price measurement is to the basics of economic governance.12.3 The European Central Bank: CPI as a Union-Building Tool
In the eurozone, the HICP has served not only as a monetary policy reference but as an instrument of regional integration. Requiring all EU member states to produce CPI data using harmonised methodology creates a basis for cross-country comparison that supports the single monetary policy conducted by the ECB for 20 diverse economies. The ECB's transparent communication of its 2% HICP target has become a model for central bank communication globally.


◆ ◆ ◆
Perhaps the most important yet underappreciated dimension of CPI in institutional governance is its distributional impact — the way in which aggregate inflation conceals profoundly unequal experiences across income groups, geographic regions, and demographic categories.
Food inflation is consistently the most regressive form of inflation — its burden falls disproportionately on households that spend larger shares of their income on food. In South Africa, low-income households in the bottom quintile spend roughly 30–40% of their budgets on food, compared to less than 10% for the wealthiest quintile. When food prices spike — as they did globally in 2022 following the Russian invasion of Ukraine, which disrupted wheat and sunflower oil exports — the effective inflation rate experienced by the poorest households dramatically exceeded the headline CPI figure.
CPI is typically measured at the national level, averaging price changes across regions that may have very different economic conditions. In countries with large urban-rural divides, a national CPI may poorly represent the inflation experienced in remote rural areas. Developing regional or provincial CPI sub-indices is a growing priority for several African statistical agencies, including Stats SA, which publishes CPI data for all nine South African provinces.
Research in feminist economics has also highlighted that women and men often experience different effective inflation rates due to systematic differences in consumption patterns. Women are the primary purchasers of food, childcare, and personal care products — categories that have experienced above-average inflation — while men disproportionately consume categories like electronics that often experience deflation due to technological progress. Developing gender-disaggregated consumption expenditure data and applying it to inflation analysis is an emerging area of work at several national statistics offices.
◆ ◆ ◆Drawing together the analysis throughout this essay, several key lessons emerge for governments and institutions seeking to strengthen their CPI systems and maximise the policy value of inflation measurement.
Strengthen statistical independence. The single most important investment a government can make is ensuring genuine operational independence for its national statistics office. This means transparent legislative protection against political interference, professional appointment processes for senior statisticians, adequate budgetary resourcing, and active public communication of the statistics office's independence mandate. Statistical independence is the foundation on which monetary policy credibility, fiscal planning accuracy, and public trust in government rests.
Modernise data collection. Statistical agencies should prioritise the integration of digital data sources — scanner data, web scraping, digital transaction records — alongside traditional price collection. This investment improves CPI accuracy, increases frequency of measurement, and reduces the cost of data collection over time. International technical assistance from IMF AFRITAC centres and World Bank statistical capacity programmes can support this modernisation in countries with limited domestic resources.
Develop disaggregated measures. Governments should invest in producing not only headline CPI but also disaggregated inflation measures — by income quintile, geographic region, demographic group, and key expenditure categories such as food and energy. These disaggregated measures are essential for designing effective social protection systems, for monitoring the distributional fairness of monetary policy, and for ensuring that fiscal transfers indexed to CPI are appropriately calibrated.
Strengthen public communication. Statistical agencies and central banks should invest in accessible, jargon-free CPI communication, including personalised inflation calculators and plain-language explanations of methodology. Bridging the gap between official statistics and public perception is essential for maintaining the democratic legitimacy of inflation-targeting frameworks.
Pursue international harmonisation. Countries should participate actively in harmonisation efforts — including the IMF SDDS, ILO CPI manual reviews, and regional harmonisation initiatives led by the African Union Statistical Institute (STATAFRIC). Peer review processes help identify measurement gaps, build institutional capacity, and demonstrate commitment to international standards.
◆ ◆ ◆The Consumer Price Index is far more than a monthly news headline or an abstract economic statistic. It is, in the deepest sense, democratic infrastructure — the measurement architecture upon which governments make decisions about how to protect their most vulnerable citizens, how to manage the macroeconomy, how to fairly adjust the wages and transfers that millions of people depend upon, and how to account for the real effects of policy decisions on living standards across the full spectrum of society.
This essay has traced the CPI across its many institutional dimensions: from its origins in wartime labour economics to its role in 21st-century central banking; from its technical construction through household surveys and price collection to its evolving integration with big data and artificial intelligence; from its application in pension adjustments and tax policy to its use in international development lending and poverty measurement; from the genuine limitations of its methodology to the profound political economy consequences of its credibility — or lack thereof.
Several themes have run through this analysis. First, the CPI is simultaneously a technical tool and a social contract — its credibility depends not only on methodological rigour but on institutional independence, transparent communication, and genuine accountability to the citizens whose lives it measures. Second, the aggregate CPI conceals distributional realities that matter enormously for social justice — the same headline number can describe very different lived experiences for a wealthy urban professional and a low-income rural household. Third, the future of CPI measurement is being reshaped by the data revolution, with both extraordinary opportunities for more granular inflation tracking and new risks of data quality, representativeness, and privacy that must be carefully managed.
For policymakers, the lesson is that investment in high-quality, independent, and disaggregated CPI measurement pays dividends that far exceed its costs — in more credible monetary policy, more targeted social protection, more accurate fiscal planning, and ultimately in stronger public trust in the institutions of economic governance. For citizens, an understanding of the CPI empowers engagement with the policy debates that shape their economic lives.“
“Building and sustaining the institutions capable of measuring inflation well — and communicating it honestly — is one of the essential tasks of contemporary economic governance. It is, ultimately, a question not just of statistics, but of trust.”
"KEY REFERENCES & FURTHER READING
— International Labour Organization (ILO). (2004, updated 2020). Consumer Price Index Manual: Theory and Practice. Geneva: ILO.
— International Monetary Fund (IMF). (2023). World Economic Outlook: A Rocky Recovery. Washington DC: IMF.
— Statistics South Africa. (2024). Consumer Price Index, December 2024. Statistical Release P0141. Pretoria: Stats SA.
— U.S. Bureau of Labor Statistics. (2024). CPI Handbook of Methods. Washington DC: BLS.
— Eurostat. (2023). Harmonised Index of Consumer Prices (HICP): Methodology. Luxembourg: Eurostat.
— World Bank. (2024). Poverty and Shared Prosperity Report: Pathways to Progress. Washington DC: World Bank.
— Boskin, M. J. et al. (1996). Toward a More Accurate Measure of the Cost of Living. Report to the Senate Finance Committee.
— Cavallo, A. & Rigobon, R. (2016). The Billion Prices Project: Using Online Prices for Measurement and Research. Journal of Economic Perspectives, 30(2), 151–178.
— African Development Bank. (2023). African Economic Outlook 2023: Mobilising Private Finance for Climate and Green Growth. Abidjan: AfDB.
— South African Reserve Bank. (2024). Monetary Policy Review, October 2024. Pretoria: SARB.


Be First to Comment