
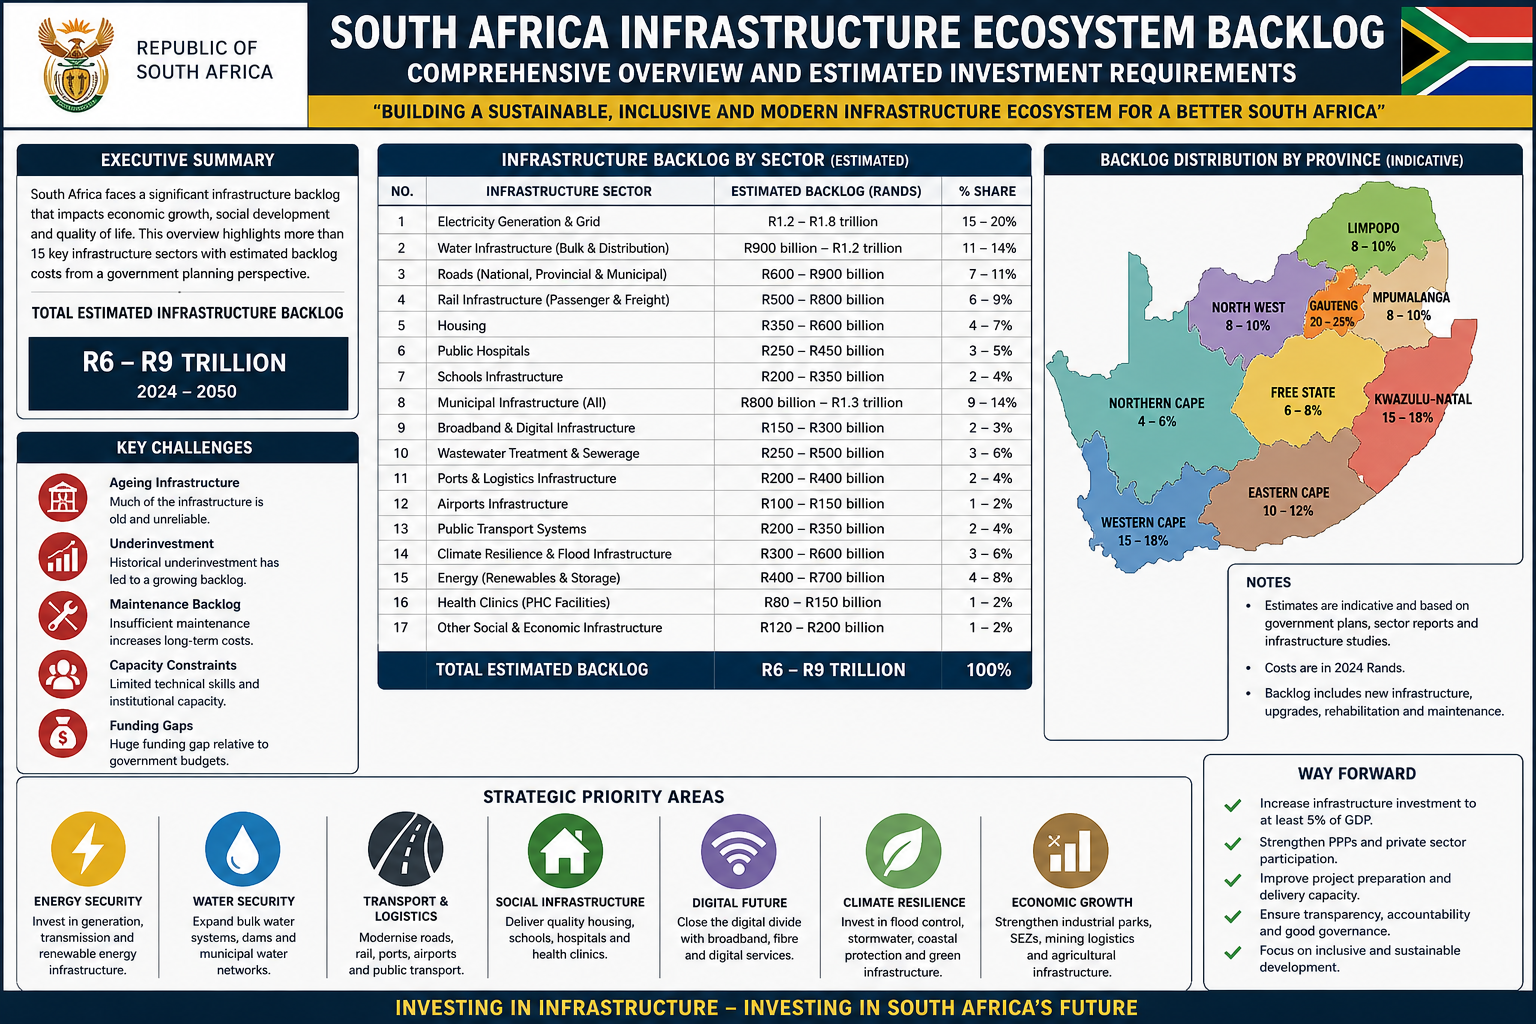
A Government-Perspective Review of Twenty Infrastructure Categories
Estimated costs, responsible entities, and the national financing response — sourced from National Treasury’s 2026 Budget Review, the National Infrastructure Plan 2050, SONA 2026, and state-owned enterprise disclosures.
1. Executive Summary
South Africa’s public infrastructure sits at a genuine inflection point. Government’s own figures place the combined value of identified and quantified backlogs at several trillion rand when long-horizon water-sector investment needs are included, with more immediately actionable municipal, provincial and state-owned enterprise backlogs concentrated in the hundreds of billions of rand.
This report assembles more than twenty distinct infrastructure ecosystem line items, organised from the vantage point of government departments, regulators and state-owned entities, and attaches to each the most recent publicly disclosed rand estimate.
20Categories assessed
R2tn+Combined near-term backlog
R1.07tn2026 MTEF public pipeline
63PPP projects in development
Report at a Glance
- 20 infrastructure categories assessed, each with a sourced rand estimate
- Combined near-term backlog across water, roads, rail, energy and housing conservatively exceeds R2 trillion
- 54.1% of the R1.07tn pipeline (R577.4bn) executed by state-owned companies and public entities
- 63 public-private partnership projects currently in development
2. Introduction: Reading the Backlog from a Government Vantage Point
This report deliberately adopts the government’s own frame of reference. Where a department, entity or National Treasury has published a specific rand figure, that figure is used and its source identified. Where estimates diverge, the report presents the range and notes the current official position.
2.1 Why the Backlog Persists
Government’s diagnostic documents point to recurring causes: chronic underinvestment in maintenance relative to new-build capex (Johannesburg Water’s R11.9bn revenue vs R1.3bn capex is the Treasury’s own cautionary example), diversion of ring-fenced service revenue, historically inherited spatial inequality, state capture (most severely at Transnet), and construction-sector criminality.
2.2 The Shift Toward a Reform-Linked Model
The 2026 Budget Speech makes clear that infrastructure spending is no longer unconditional: municipalities that fail to ring-fence revenue face reduced allocations, while compliant municipalities are prioritised for support — a shift from grants-based entitlement toward performance-linked conditional financing.
2.3 Fiscal History & 2.4 International Benchmarking
Fixed investment fell to 14.2% of GDP in 2024 (from 14.8%), well below the NDP’s 30% target. Peer emerging markets sustaining high-growth infrastructure phases (Indonesia, Vietnam, historic China) maintained ratios above 25% of GDP for extended periods — underscoring the scale of South Africa’s shortfall.
3. Sector-by-Sector Infrastructure Ecosystem Backlog
1 · Municipal Water & Sanitation Bulk Infrastructure
R400 billion — Department of Water and Sanitation. Compares with just R12.3bn allocated for RBIG/WSIG in 2025/26. More than 70% of SA’s 144 water services authorities struggle to provide reliable basic water services.
2 · Water Sector Investment Requirement to 2050
R6.0 – R8.79 trillion — DBSA sector study (2022 real rand). Covers both capex and opex through to 2050, factoring in climate change impacts on water resources.
3 · City of Johannesburg Water Backlog
R64 billion — cited directly by Finance Minister Godongwana in the 2026 Budget Speech as a cautionary case of revenue diversion.
4 · Stormwater Infrastructure
≈R1 trillion — civil engineering sector estimate (SA Water Chamber), amid rising flood/extreme-weather frequency.
5 · Municipal Road Network Backlog
R197 billion — Department of Transport, covering 90,701 km paved + 201,506 km unpaved municipal roads.
6 · Provincial Road Rehabilitation
R185.9 billion — National Treasury Intergovernmental Fiscal Review. PRMG provides R36bn/year (~80.7% of provincial road maintenance funding).
7 · Road Accident Fund Liability
Growing contingent liability linked directly to road quality; 11,418+ road deaths in the latest reporting year prompted the Transport Minister to call road safety a “national crisis.”
8 · Electricity Transmission Infrastructure
R390 – R400 billion over the next decade — Eskom’s Transmission Development Plan targets 14,500 km of new lines and 133,000 MVA of transformers by 2034. Delivery rate needs to scale ~8x.
9 · Eskom Generation Fleet Maintenance
Addressed via the Generation Recovery Plan: 5,506 MW restored in one year; EAF up to 65.35%; 322 consecutive days without load-shedding to end-March 2026.
10 · Municipal Electricity Distribution
Embedded within the R400bn municipal figure; addressed via the R27.7bn metro trading entity reform grant.
11 · Transnet Freight Rail Maintenance & Renewal
R50 billion backlog (2023); R26.7–28.2bn/year required ongoing. Cumulative R149bn in government guarantees extended; volumes recovering to ~171 million tonnes.
12 · Rail & Port Corridor Capital Projects
R21.9 billion approved under the Budget Facility for Infrastructure for coal (77Mt) and iron ore (60Mt) corridor restoration.
13 · Passenger Rail Modernisation (PRASA)
Targeting 250–450 million annual passenger trips (from 77 million), within the broader transport MTEF budget.
14 · Human Settlements / Housing Backlog
2.6 million units; historical FFC estimate of R800 billion+ to clear a smaller 2.1m-unit backlog. R81.364bn MTEF allocation, though R20.6bn baseline cut looms.
15 · Health Facility Infrastructure
R7.9 billion current backlog; up to R8 billion to replace 20% of primary healthcare facilities entirely.
16 · Education Infrastructure Backlog
R23 billion addressed to date (373 schools, 67 classrooms); R50.4 billion Education Infrastructure Grant over the medium term.
17 · Digital / ICT Infrastructure
R3 billion SA Connect Phase 2 — ~1,180 km fibre, ~5.6 million households, 6,343 government facilities connected.
18 · Combined Municipal Infrastructure Backlog
R400 billion — DWS consolidated cross-sectoral figure spanning water, sanitation, roads and stormwater in struggling municipalities. 63% of municipalities in financial distress.
19 · Metropolitan Trading Entity Reform Grant
R27.7 billion over the medium term — performance-based, ring-fencing revenue for electricity, water, sanitation and waste management reinvestment.
20 · Project Preparation & PPP Facilitation
R180 million Infrastructure SA preparation fund; 63 PPP projects in development; R95bn private investment announcements; R445bn total public+private pipeline (Nedbank).
3B. Provincial Distribution of Backlog Exposure
| Province | Primary Exposure | Notable Response |
|---|---|---|
| Gauteng | Housing backlog concentration; electricity theft | R32.5bn Tshwane bulk infrastructure requirement |
| KwaZulu-Natal | Flood damage; rail frequency | Disaster PRMG top-ups; PRASA frequency gains |
| Western Cape | Housing (Cape Town informal settlements) | WC Infrastructure Framework 2050 |
| Eastern Cape | Rural water access; road backlog (~R23bn) | Amatola Water Board interventions |
| Mpumalanga & Limpopo | Coal haulage road damage; rural electrification | Coal haulage grants; smart meter priority |
| Free State & North West | Transmission grid saturation | Independent Transmission Projects priority |
| Northern Cape | Renewable transmission congestion | ITP programme; solar PV development |
3C. Timeline of Key Reform Milestones
| Date | Milestone |
|---|---|
| 2020 | Transnet Economic Reconstruction Plan commits to third-party rail access |
| 2022 | National Infrastructure Plan 2050 Phase 1 approved |
| 2023 | Transnet Recovery Plan published; R50bn backlog quantified |
| Jul 2025 | Independent Transmission Projects programme launched |
| Aug 2025 | 11 of 25 private rail operators qualify for network access |
| 2025 | Metro trading entity grant introduced (R27.7bn MTEF) |
| Feb 2026 | Budget Speech confirms R1.07tn medium-term pipeline |
| Apr 2026 | IFISA operational at DBSA; Education Infrastructure Grant consolidated |
| Jun 2026 (planned) | Municipal PPP regulations finalised |
| Later 2026 (planned) | Transmission credit guarantee vehicle operational |
3D–3G. Interdependencies, Case Studies & Oversight
Water ↔ Energy
Water treatment is energy-intensive; several Eskom coal stations depend on dedicated cooling-water allocations — a bidirectional dependency behind combined water-electricity municipal reform.
Roads ↔ Rail
Constrained rail freight capacity shifts cargo onto roads, accelerating wear — explaining targeted coal-haulage road grants in Mpumalanga.
Case Study: Eskom’s Generation Recovery
5,506 MW restored in one year through maintenance-first strategy under strict Debt Relief Act borrowing limits — EAF up 65.35%, diesel cost down 62% y/y.
Case Study: GFIP E-Tolls
South Africa’s cautionary tale in user-pays financing: gantries switched off after sustained public resistance; SANRAL debt now serviced via direct fiscal transfers instead.
Institutional Oversight Snapshot
- Water: DWS — Blue/Green Drop reports, RBIG/WSIG conditions
- Energy: Eskom / Dept. of Electricity & Energy — weekly system updates, NERSA oversight
- Rail/Ports: Transnet — Recovery Plan reporting, Network Statement
- Housing: Dept. of Human Settlements — National Housing Needs Register
4. Master Reference Table
| # | Category | Estimated Value | Responsible Entity |
|---|---|---|---|
| 1 | Municipal water & sanitation | R400bn | DWS |
| 2 | Water sector 2050 requirement | R6.0–8.79tn | DBSA/DWS |
| 3 | Johannesburg water backlog | R64bn | Joburg Water/Treasury |
| 4 | Stormwater infrastructure | ≈R1tn | Municipalities/DWS |
| 5 | Municipal road backlog | R197bn | Dept. of Transport |
| 6 | Provincial road rehabilitation | R185.9bn | Treasury/Provinces |
| 7 | RAF contingent liability | Growing/unquantified | Road Accident Fund |
| 8 | Electricity transmission | R390–400bn | Eskom/DEE |
| 9 | Eskom generation maintenance | Recovery Plan-managed | Eskom |
| 10 | Municipal electricity distribution | Within R400bn figure | Metros |
| 11 | Transnet rail maintenance | R50bn + R26.7–28.2bn/yr | Transnet Freight Rail |
| 12 | Rail/port corridor projects | R21.9bn (BFI) | Transnet/Treasury |
| 13 | Passenger rail (PRASA) | Within transport MTEF | PRASA |
| 14 | Human settlements backlog | 2.6m units; R800bn+ | Dept. Human Settlements |
| 15 | Health facility infrastructure | R7.9bn + R8bn | DPWI/Health |
| 16 | Education infrastructure | R23bn + R50.4bn MTEF | Basic Education |
| 17 | Digital/ICT (SA Connect) | R3bn | DCDT/SITA |
| 18 | Combined municipal backlog | R400bn | DWS/CoGTA |
| 19 | Metro trading entity grant | R27.7bn | National Treasury |
| 20 | Project preparation/PPP | R180m; 63 PPPs | Infrastructure SA |
Not additive: items 2 and 18 substantially overlap items 1 and 4. A defensible non-overlapping “floor” across water, roads, transmission, rail, housing, health and education comfortably exceeds R2 trillion.
5. Government’s Financing & Reform Response
R1.07 trillion medium-term public pipeline: 54.1% (R577.4bn) via SOEs/public entities, R217.8bn provinces, R205.7bn municipalities. Capital payments growing ~10%/year vs 4.4% for compensation.
Key Instruments
- Budget Facility for Infrastructure — R21.9bn approved for rail/port corridors
- Infrastructure Fund — ~R96bn blended-finance pipeline
- IFISA — operational 1 April 2026, housed at DBSA
- Credit Guarantee Vehicle — transmission de-risking, with World Bank
- Metro Trading Entity Grant — R27.7bn performance-linked
- Reformed Municipal Infrastructure Grant — split delivery model
6. Risk Factors and Delivery Constraints
Construction-sector criminality (“construction mafia”), municipal financial distress (63% of municipalities), technical skills shortages (~8x scale-up needed for transmission delivery), the Transnet state-capture legacy, climate/extreme-weather exposure, debt sustainability, SOE balance-sheet constraints, and data/measurement inconsistency across departments.
7. Strategic Recommendations
- Consolidate backlog reporting into a single annual register
- Protect ring-fenced municipal revenue by law, not just grant condition
- Accelerate Eskom transmission unbundling
- Scale project preparation capacity at Infrastructure SA
- Expand private capital participation deliberately
- Formalise cross-sectoral sequencing
- Strengthen the Zondo Commission’s institutional legacy
- Build municipal technical capacity directly, not only through grants
- Publish standardised provincial backlog dashboards
- Treat climate resilience as a backlog multiplier, not an add-on
8. Conclusion
South Africa’s infrastructure ecosystem backlog is a set of twenty-plus distinct, quantifiable liabilities, each with an identifiable owner and, in most cases, a reform programme underway. The R1.07-trillion pipeline is the most significant fiscal commitment in over a decade, and early indicators — 322 days without load-shedding, recovering Transnet volumes, reformed municipal grants — suggest real progress. But at a combined backlog exceeding R2 trillion, success will be measured over a decade or more, not a single budget cycle.
Appendix C: Frequently Asked Questions
Why do sources quote different backlog figures?
They measure different things — repair-to-standard cost vs. full replacement vs. multi-decade investment requirement. Always check the underlying methodology.
Is R1.07tn enough to clear the backlog?
No — it’s the fiscally sustainable medium-term contribution, to be supplemented by blended finance and private capital, not a one-time fix.
Has anything actually improved?
Yes: Eskom generation availability and load-shedding cessation, plus Transnet freight volume recovery, represent genuine, measurable gains.





Be First to Comment