
A Comprehensive Country-by-Country Analysis of Innovation Leadership in Science, Technology, and Industry
Executive Summary
Patents are the clearest paper trail that innovation leaves behind. Every application filed at a national or regional office is a formal declaration that someone, somewhere, believes they have created something new, useful, and worth protecting. Taken individually, a patent is a narrow legal instrument. Taken in aggregate across 150-plus national offices and more than three million filings a year, patent data becomes one of the most reliable proxies available for measuring where the world’s scientific and industrial energy is actually concentrated. This essay uses the most recent data published by the World Intellectual Property Organization (WIPO), the European Patent Office (EPO), the United States Patent and Trademark Office (USPTO), and allied national IP offices to build a detailed, country-by-country and industry-by-industry picture of who is leading global innovation, and why.
The headline finding is unambiguous: the center of gravity of global patenting has shifted decisively toward Asia. In 2014, Asian applicants accounted for roughly 60 percent of all patent applications filed worldwide. By 2024 that share had climbed past 70 percent, driven overwhelmingly by China, whose national office alone now receives close to half of all patent applications filed on earth. The United States remains the single most important originator of high-value, internationally filed patents and continues to dominate several strategic technology fields, particularly artificial intelligence software and computing architecture. Japan and the Republic of Korea remain extraordinarily patent-intensive relative to the size of their economies and populations. Germany anchors European innovation in transport, industrial machinery, and precision engineering, while a cluster of smaller, highly specialized economies — Switzerland, the Netherlands, Finland, and Sweden — punch far above their population weight in patents per capita and patents per unit of GDP.
This document is organized in four movements. First, it lays out the global numbers and the structural forces reshaping them. Second, it walks through the leading patenting nations one at a time, examining each country’s institutional strengths, flagship companies, and sectoral specializations. Third, it turns the analysis on its head and looks industry-by-industry — computing and digital communication, artificial intelligence, semiconductors, biotechnology and pharmaceuticals, clean energy and batteries, automotive and transport, and quantum technologies — to identify which countries and companies actually lead in each. Fourth, it closes with an assessment of what these patterns mean for policymakers, investors, and organizations building long-term research and development strategy.
Table of Contents
Introduction: Why Patents Matter as a Measure of National Capability
Methodology and Data Sources
Part One — The Global Patent Landscape in Numbers
Part Two — Country-by-Country Analysis
Part Three — Industry-by-Industry Leadership
Part Four — Corporate and Institutional Leadership
Part Five — Strategic Implications and Outlook
Part Six — Comparative Data Tables
Part Seven — Governance, Investment, and Organizational Implications
Part Eight — Five Corporate Case Studies
Part Nine — Beyond Patents: Trademarks, Industrial Designs, and the Broader Intellectual Property Picture
Part Ten — A Decade in Review: Key Turning Points, 2014 to 2025
Frequently Asked Questions
Glossary of Key Terms
Appendix: Regional Summary and Innovation-to-Development Correlation
Sources and Data Notes
Introduction: Why Patents Matter as a Measure of National Capability
Long before patent statistics became a staple of economic and geopolitical analysis, the patent itself was a relatively narrow legal device: a state-granted, time-limited monopoly offered to an inventor in exchange for publicly disclosing how an invention works. The bargain has remained essentially unchanged since the earliest modern patent statutes were enacted in Europe several centuries ago, but the scale and strategic significance of the system it created has grown almost beyond recognition. Today, a single technology field, such as fifth-generation mobile communication standards, can generate tens of thousands of individually contested patent families, each one representing a small claim on the licensing revenue of an entire global industry. Understanding who holds these claims, and in what proportion, has become inseparable from understanding the underlying balance of technological and economic power between nations.
This is precisely why patent statistics have become one of the most closely tracked datasets in applied economics and industrial policy over the past two decades. Unlike gross domestic product figures, which are revised, estimated, and subject to substantial definitional disagreement between countries, patent filing data is comparatively precise: an application either was filed at a given office in a given year, or it was not, and WIPO’s statistics database aggregates this information from over 150 national and regional intellectual property offices into a single, internationally comparable dataset. The resulting picture, examined at length throughout this essay, offers a rare thing in international economic analysis: a genuinely apples-to-apples comparison of national innovative output, refreshed annually, and detailed enough to be broken down by individual technology field, corporate applicant, and even research institution.
It is worth being clear-eyed, however, about what patent data can and cannot tell us. A patent application is a signal of intended innovation, not proof of ultimate commercial success; many patented inventions are never commercialized at all, while some of the most commercially transformative technologies in history, including several foundational internet protocols, were deliberately never patented by their inventors. Patent counts can also be inflated by defensive filing strategies, in which companies patent minor variations on existing technology purely to block competitors or to build negotiating leverage in cross-licensing disputes, rather than because the underlying invention represents genuine technical advance. With these caveats in mind, the remainder of this essay treats patent data as what it actually is: the single best available quantitative proxy for the direction and intensity of formal research and development investment across the modern global economy, to be read alongside, rather than instead of, other measures of national scientific and industrial capability such as research spending, scientific publication output, and venture capital investment.
Methodology and Data Sources
The statistics and rankings presented throughout this essay are drawn primarily from four authoritative sources. The World Intellectual Property Organization’s annual World Intellectual Property Indicators report and its companion IP Facts and Figures summary provide the backbone of the global filing, patents-in-force, and per-capita and per-GDP intensity figures used throughout Parts One and Two, drawn from WIPO’s Statistics Database as compiled from national office submissions as of September 2025. WIPO’s PCT Yearly Review and its 2026 international filings press release provide the detailed data on Patent Cooperation Treaty filings used in the discussion of high-value international patents in Part One and the corporate filer rankings in Part Four. The European Patent Office’s Technology Dashboard, formerly published as the EPO Patent Index, provides the sector-specific breakdowns by technology field and country of origin used extensively in Part Three’s industry-by-industry analysis. Finally, independent compilations of United States Patent and Trademark Office grant data supplement the American domestic patenting picture discussed in Section 2.2.
Two definitional distinctions recur throughout this essay and are worth clarifying up front. First, the distinction between office data and origin data: office data counts applications received by a given national or regional patent office regardless of the applicant’s nationality, while origin data counts applications by the country of residence of the first-named applicant regardless of which office received the filing. This essay generally uses origin data when discussing “which country leads,” since it better answers the question of where inventive activity is actually occurring, while noting office-level figures, such as the dominance of the China National Intellectual Property Administration, where relevant to understanding administrative filing volume specifically. Second, the distinction between patent applications, a flow measure counting new filings in a given year, and patents in force, a stock measure counting the accumulated total of all patents currently valid and enforceable, which behaves quite differently over time, as discussed in Section 1.3.
Readers should also bear in mind two structural limitations common to all internationally comparable patent statistics. Origin data is necessarily a baseline estimate rather than a fully complete count, since a small number of national offices report only aggregate application totals without breaking filings down by the applicant’s country of residence, and applications filed through certain regional systems can be counted using an equivalent-count methodology that differs from a simple one-to-one filing count. And because patent applications typically take twelve to eighteen months to be published and longer still to be examined and granted, the most recent full year of data available at any given time, generally the prior calendar year, always reflects research and filing decisions made somewhat earlier, meaning that patent statistics function best as a lagging rather than a real-time indicator of innovation activity.
Part One — The Global Patent Landscape in Numbers
1.1 Total Filing Volumes and the Asian Ascendancy
Worldwide patent applications reached roughly 3.7 million in 2024, a year-on-year increase of close to five percent and a new historical record. Utility model filings, a lighter-weight form of protection used heavily in China, Germany, and several emerging economies, grew at a similar pace to reach an estimated 3.3 million. The growth was not evenly distributed. Asia’s share of global filings rose from 60 percent a decade ago to just over 70 percent today, while North America’s share fell from roughly 23 percent to 17 percent and Europe’s share slipped from just under 13 percent to under 10 percent over the same period. Africa, Latin America, and Oceania combined now account for only about 3 percent of global filings, a figure that has itself declined slightly over the past decade even as individual countries within those regions, such as Brazil, Turkey, and Kenya, have posted strong percentage growth from a low base.
The reason for Asia’s rise is almost entirely attributable to one country. China’s national intellectual property office now receives close to half of all patent applications filed anywhere in the world, and Chinese-origin applicants — counting both domestic filings and filings made abroad — submitted approximately 1.8 million patent applications globally in 2024. The next four origins by total volume were the United States (approximately 502,000 applications), Japan (approximately 419,000), the Republic of Korea (approximately 296,000), and Germany (approximately 133,000). China’s share of the Chinese national office’s own intake has grown from just under 35 percent of world filings in 2014 to 49 percent in 2024, meaning that essentially the entirety of the shift toward the top five offices’ combined dominance (now 85.5 percent of world filings, up from 82 percent a decade ago) is a China-driven phenomenon.
1.2 Quality-Adjusted and Intensity-Adjusted Measures
Raw filing counts favor large economies with large domestic markets, so intellectual property economists increasingly look at three adjusted measures: filings abroad (a proxy for high commercial value, since foreign filing is expensive and applicants only do it for inventions they expect to be profitable internationally), filings per capita, and filings per unit of GDP. On filings abroad, the United States has held the top position since 2013, filing at least 231,000 applications outside its own borders in 2024, ahead of Japan (approximately 182,000), China (approximately 124,000), the Republic of Korea (approximately 100,000), and Germany (approximately 68,000). This is the single strongest piece of evidence that, even as China dominates on raw volume, the United States remains the leading source of patents whose owners judge to be worth the expense of international protection.
Per-capita figures tell a different story again. The Republic of Korea leads the world with roughly 3,783 patents per million inhabitants, followed by Japan (about 1,913) and Switzerland (about 1,235). China ranks a more modest fourth on this measure despite its enormous absolute volume, a reminder that population size still matters when interpreting raw filing totals. On a GDP-adjusted basis, China again tops the list, registering nearly 4,977 resident patent applications for every USD 100 billion of economic output in 2024, followed closely by Japan (about 4,150), then Switzerland, Finland, and Germany. Small, R&D-intensive Nordic economies — Denmark, Finland, and Sweden — consistently appear in the global top ten by this measure despite having comparatively modest absolute filing counts, underscoring that patent intensity and patent volume are two different stories that must be read side by side.
1.3 Patents in Force and the Stock of Accumulated Innovation
Filing volume measures the flow of new invention; the stock of patents currently in force measures the accumulated result. Worldwide patents in force grew roughly 6 percent in 2024 to an estimated 19.7 million. China holds the largest stock by a wide margin, with about 5.7 million patents currently in force, followed by the United States with about 3.5 million and Japan with about 2.1 million. This stock measure is instructive because it captures decades of compounding institutional investment in research and development rather than a single year’s snapshot, and it shows that even though China’s dominance in annual filing volume is a relatively recent phenomenon dating mostly to the 2010s, its accumulated patent stock has already overtaken the United States, which held the position of the world’s leading patent-filing office in nearly every year between 1883 and 1963.
1.4 The International Filing Route: PCT Applications
The Patent Cooperation Treaty (PCT), administered by WIPO, allows an applicant to seek protection in dozens of countries through a single international application before it later splits into national or regional phases. Because PCT filings are almost always reserved for inventions an applicant considers commercially significant, PCT statistics are widely treated as the best available proxy for high-value global innovation. In 2025, some 275,900 PCT applications were filed worldwide, a modest 0.7 percent increase on 2024 but the second consecutive year of growth after a downturn. China contributed the largest share with 73,718 applications (up 5.3 percent), followed by the United States with 52,617 (down 3.0 percent, a fourth consecutive annual decline), Japan with 47,922 (down 1.0 percent), the Republic of Korea with 25,016 (up 4.9 percent, extending an unbroken 28-year growth streak), and Germany with 16,441 (down 1.8 percent). The pattern is consistent and important: China and the Republic of Korea are the two fastest-growing major origins in the world’s most prestigious filing channel, while the three traditional pillars of twentieth-century innovation — the United States, Japan, and Germany — are each now filing fewer PCT applications year over year.
At the corporate level, Huawei Technologies of China has been the single largest PCT filer in the world every year since 2017, filing 7,523 published applications in 2025 alone. It was followed by Samsung Electronics of South Korea (4,698), Qualcomm of the United States, LG Electronics of South Korea (2,400), and Contemporary Amperex Technology (CATL), the Chinese battery maker, rounding out the top five. This corporate list is itself a small case study in where innovation investment is actually flowing: two Chinese firms, two South Korean firms, and one American firm dominate the world’s premier international filing channel, with European and Japanese corporate champions such as Nokia, Panasonic, and Ericsson clustered just behind them.
Part Two — Country-by-Country Analysis
2.1 China: Volume Leader and Rising Quality Contender
China’s transformation from a patent-filing minor player in the 1990s to the unrivaled global leader in filing volume is arguably the single most important structural story in global innovation policy of the past twenty-five years. The China National Intellectual Property Administration (CNIPA) now processes more patent applications annually than the next several national offices combined, and Chinese-origin applicants file close to 1.8 million patent applications a year once domestic and foreign filings are combined. This growth was not accidental. It reflects two decades of deliberate state policy that tied local government performance evaluations, university funding, and corporate subsidies to patent output, alongside genuine and increasingly sophisticated private-sector research investment from firms such as Huawei, Tencent, Alibaba, BYD, and CATL.
China’s specialization by technology field is instructive. Its PCT applicants file most intensively in digital communication, a category that includes 5G and broader telecommunications infrastructure, reflecting Huawei’s enormous individual footprint. China is also the fastest-growing major origin in biotechnology, though the sector is structurally different from Chinese strength in semiconductors: rather than being dominated by two or three national champions, Chinese biotech patenting is spread across a large and fragmented population of small and medium biotechnology firms and university laboratories, a pattern WIPO’s most recent technology report identifies as one of the defining features of the 2025 to 2026 biotech patent landscape. China has also become the fastest-growing country of origin for patents filed at the European Patent Office, overtaking Germany in 2025 to become the third-largest source of European patent applications for the first time in the EPO’s history, trailing only the United States and Germany.
The caveat that must accompany any discussion of Chinese patent volume is quality and intent. A meaningful share of Chinese filings are utility models rather than full invention patents, a lighter-weight and less rigorously examined form of protection, and domestic filing incentives have historically produced a tail of low-value applications filed primarily to satisfy local subsidy programs rather than to protect commercially significant inventions. That said, the trend in abroad filings, where Chinese applicants posted a 2.8 percent increase in 2024, one of the strongest growth rates among major origins, and China’s rising share of PCT filings, EPO filings, and biotechnology and semiconductor patenting all point toward a country whose patent activity is becoming steadily higher in average quality even as it remains overwhelming in sheer scale.
2.2 United States: The Value Leader Facing Relative Decline
The United States remains, by several important measures, the world’s most consequential single source of high-value patented invention, even as its share of total global filings has fallen from roughly 22 percent in 2014 to 17 percent in 2024. Three facts anchor this claim. First, the United States has led the world in patent applications filed abroad every year since 2013, a measure widely read as the best single proxy for patents an applicant considers commercially valuable enough to justify the expense of international protection. Second, American companies dominate the artificial intelligence patent category at the European Patent Office, with Alphabet, Microsoft, and Qualcomm ranked first, fourth, and fifth respectively among all AI patent filers in 2025. Third, American universities, led by the University of California system, remain the most prolific research institutions in the world by patent output, with MIT and Stanford close behind.
At the same time, the trend lines are working against the United States. American PCT filings fell for a fourth consecutive year in 2025, down 3.0 percent to 52,617, and the U.S. Patent and Trademark Office itself issued a nearly flat 327,641 patents in fiscal year 2025, up just 0.2 percent on the prior year. Analysts who track USPTO grant data note a consistent pattern of Asian conglomerates, Korean, Japanese, and Taiwanese firms in particular, occupying an outsized share of top patent recipients in semiconductor and consumer electronics categories even within the American domestic patent system. American life sciences patenting has also softened: at the European Patent Office, U.S.-origin biotechnology filings fell roughly 9 percent and pharmaceutical filings fell roughly 10 percent in the most recent reporting year, even as U.S. medical technology filings ticked up modestly. The overall picture is one of a country that remains the preeminent producer of the most commercially significant, internationally protected inventions, particularly in software and artificial intelligence, but whose relative share of total global innovative output is being steadily diluted by faster-growing rivals.
2.3 Japan: Quality Over Quantity in a Mature Innovation Economy
Japan occupies a distinctive position in the global patent landscape: it is neither the volume leader nor the fastest grower, but it remains, by intensity measures, one of the most patent-productive societies on earth. Japan’s patent-to-population ratio of roughly 1,913 per million ranks second globally behind only the Republic of Korea, and its patent-to-GDP intensity of roughly 4,150 applications per USD 100 billion of output trails only China. Japan’s PCT filings fell modestly in 2025, continuing a third consecutive year of decline, and its patent-to-population ratio has itself fallen from 2,090 in 2014 to 1,913 in 2024, a trend driven by declining domestic filings rather than any collapse in innovative capacity, a symptom, most analysts agree, of Japan’s aging population and a corporate sector that has matured past the aggressive patent-stockpiling strategies of the 1980s and 1990s.
Japan’s technological specialization remains centered on precision engineering, robotics, advanced materials, and imaging technology, with electrical machinery representing the largest single share of Japanese-origin patent filings, roughly 10 percent of all Japanese applications during the most recent three-year reporting window. The Tokyo-Yokohama metropolitan region remains, by patent density, the single most concentrated hub of inventive activity anywhere on the planet. Corporate leadership is concentrated in Toyota, Panasonic, and Sony, all of which are consistently ranked among the world’s highest-value patent filers even as their raw filing counts have plateaued. Japan’s strategic position, in short, is that of a mature, quality-focused innovation economy whose institutions have chosen depth and commercial value over the sheer scale pursued by China, even at the cost of ceding the volume rankings.
2.4 The Republic of Korea: The World’s Most Patent-Intensive Major Economy
South Korea is arguably the single most patent-intensive major economy in the world today. It leads all nations in patents per capita, at roughly 3,783 per million inhabitants, more than double Japan’s rate and triple Switzerland’s. It is also the only one of the world’s five largest patent-filing origins whose PCT applications have grown every single year for 28 consecutive years, a streak unmatched by any other major economy, and it posted the strongest resident-filing growth of the top five origins in the most recent reporting year. Two Korean conglomerates, Samsung Electronics and LG Electronics, rank second and fourth respectively among the world’s largest PCT filers, and Samsung, alongside Huawei and LG, has maintained a position among the top three applicants at the European Patent Office for consecutive years.
South Korea’s specialization is concentrated heavily in electrical machinery, apparatus, and energy, and its applicants filed most intensively in that category during the most recent EPO reporting window, alongside German and Japanese applicants. The country’s persistent growth and intensity reflect a deliberate, decades-long national strategy that treats patenting as core industrial policy rather than an incidental byproduct of research, embedding patent output targets directly into the operations of its chaebol conglomerates and its national research funding agencies. South Korea’s trajectory over the past three decades, from a technology-importing economy in the 1970s to one of the two or three most consistently innovative economies in the world today, is frequently cited as the clearest example available of how sustained public and private investment in research and development, backed by an intellectual property system designed to reward commercialization, can compound over a single generation into world-leading innovation output.
2.5 Germany and the Wider European Innovation System
Germany remains Europe’s clear innovation anchor, ranking fifth globally in raw patent filing volume with roughly 133,000 applications in 2024 and second at the European Patent Office behind only the United States, with 24,476 applications in 2025. Germany’s technological identity is built around transport and industrial machinery, in which its applicants file most intensively of the world’s top five origins, alongside deep strength in automotive engineering, precision manufacturing, and industrial automation. Germany’s PCT filings, however, have now fallen for three consecutive years, a decline of 1.8 percent in the most recent period, mirroring the broader softening seen across Japan and the United States and reinforcing a pattern in which the traditional mid-twentieth-century industrial powers are collectively losing filing share to a faster-growing cohort of Asian economies.
Beyond Germany, the European picture is one of small, highly specialized economies achieving outsized influence. The Netherlands is home to ASML, the world’s dominant supplier of the extreme ultraviolet lithography machines required to manufacture the most advanced semiconductors, and Dutch applicants file heavily in semiconductors, renewable energy, and agricultural technology, with more than half of Dutch PCT filings involving international co-applicants, the clearest evidence available of the country’s globally networked innovation model. Switzerland ranks third in the world in patents per capita and fourth in patents per unit of GDP, reflecting its concentration of world-leading pharmaceutical, precision instrument, and specialty chemical firms. Finland and Sweden both appear consistently in the global top ten for GDP-adjusted patent intensity despite modest absolute filing counts, a Nordic pattern rooted in telecommunications heritage, Nokia and Ericsson, and continued strength in industrial and clean technology research. At the European Patent Office overall, Europe-based applicants led in eight of the ten largest technology fields in the most recent reporting year, even as the United States retained the single largest share of total applications and China overtook Germany for third place for the first time in EPO history, a milestone widely read as a signal of a genuine three-way contest emerging for the leadership of European patent filings.
2.6 India: The Fastest-Growing Major Emerging Innovator
India represents the most dramatic growth story among large emerging economies. Patent applications filed worldwide by India-based applicants surged 19.1 percent in 2024, the sixth consecutive year of double-digit growth, driven overwhelmingly by expansion in domestic resident filings rather than by Indian applicants filing abroad. This sustained multi-year acceleration reflects a combination of government initiatives explicitly designed to encourage patenting, including Digital India and Make in India, alongside a rapidly maturing domestic start-up ecosystem that is increasingly filing internationally rather than only at home. India’s institutional strengths are concentrated in pharmaceuticals, biotechnology, software, and electronics, sectors in which the country’s enormous base of engineering and life-sciences graduates provides a deep talent pipeline. Despite this growth, India still ranks 16th globally by patent-to-GDP intensity and does not appear in the global top 20 for patents per capita, underscoring that India’s transformation into a major innovation economy remains at an earlier stage than China’s was even a decade ago: the growth rate is exceptional, but the base from which it is growing remains comparatively small relative to India’s population and economic size.
2.7 Taiwan and the Semiconductor Periphery
Taiwan occupies an outsized position in global technology despite falling outside most official WIPO country rankings, a consequence of its unique diplomatic status rather than any deficiency in its innovative output. Historical data from the Taiwan Intellectual Property Office shows filing volumes that would place the island in the world’s top six by raw count and second globally on a per-capita basis if it were included in standard international comparisons. Taiwan’s institutional strength is heavily concentrated in semiconductor manufacturing and design, machine vision, and precision electronics, home as it is to Taiwan Semiconductor Manufacturing Company (TSMC), the world’s dominant advanced-node chip foundry, and Foxconn, historically one of the most prolific individual patent filers tracked by WIPO. Taiwan’s position illustrates a broader truth about the modern patent landscape: geopolitical and statistical classification questions aside, the island functions as one of the two or three most consequential single locations on earth for semiconductor innovation, alongside the United States and South Korea, and any serious industrial policy analysis of the global chip supply chain must treat it as a first-tier innovation economy in practice even where it is excluded from first-tier country rankings on paper.
2.8 Emerging and Middle-Income Innovators
Beneath the tier of established innovation powers, a second cohort of middle-income economies is beginning to register meaningfully on global patent statistics, even though their absolute contribution remains a small fraction of total world filings. Brazil filed nearly 8,000 patent applications in 2024, with resident applicants accounting for 72 percent of that total, and Brazilian applicants stood out globally in utility model filings, submitting over 3,000 applications and posting growth above 27 percent. Turkey filed over 11,500 patent applications with resident filers accounting for the overwhelming majority, while Iran filed over 8,400, nearly all, 98.6 percent, from domestic resident applicants, reflecting a largely inward-facing innovation system driven by domestic industrial substitution rather than international commercial ambition. Kazakhstan posted utility model growth of roughly 33 percent and the Philippines filed 1,659 utility model applications, while Kenya recorded the fastest utility model growth rate of any tracked origin in the most recent year, at 51 percent, albeit from a very small base. None of these countries yet approaches even one percent of global filing volume, but their consistent multi-year growth, particularly in the lighter-weight utility model category often used by smaller firms and individual inventors, suggests a broadening rather than a narrowing of the base of countries engaged in formal innovation activity.
Part Three — Industry-by-Industry Leadership
3.1 Computer Technology and Digital Communication
Computer technology has been the single largest patent category in the world for several consecutive years and grew further in the most recent reporting period, up 6.1 percent at the European Patent Office alone, driven substantially by artificial intelligence-related filings, which grew 9.5 percent. Three origins dominate this field: China, the Republic of Korea, and the United States together account for the overwhelming majority of computer technology patents, with China and South Korea filing most intensively in computer technology relative to their total portfolios, 15.2 percent and 10.1 percent of all published applications respectively during the most recent three-year window, and the United States close behind at 14.2 percent. Digital communication, the closely related category encompassing 5G and broader telecommunications infrastructure, is China’s single largest area of specialization by patent volume, reflecting Huawei’s position as the world’s largest individual patent filer for nine consecutive years.
Standard-essential patents (SEPs) represent the most commercially significant subset of this category, since a patent incorporated into an internationally adopted communications standard can extract licensing revenue from every company implementing that standard worldwide. Approximately 56,000 5G standard-essential patent families had been established as of early 2025, and the competition to control this pool is dominated by a small handful of firms: Huawei, Qualcomm, Samsung, Nokia, and Ericsson. This is a field where patent counts translate almost directly into recurring royalty income, making it one of the most closely watched categories by corporate strategists and antitrust regulators alike.
3.2 Artificial Intelligence
Artificial intelligence patenting has become the fastest-growing and most closely watched single technology category in the world. By 2025, China had established a commanding lead in raw AI patent volume, accounting for more than 70 percent of all AI-related patent applications filed globally, a reflection of a deliberate national strategy to position China as a dominant AI power over the coming decade. The United States, while filing far fewer AI patents in absolute terms, has pursued what analysts describe as a strategic pivot toward fewer but more substantial applications, and continues to lead the field by patent value and commercial significance: at the European Patent Office, Alphabet, Microsoft, and Qualcomm ranked first, fourth, and fifth respectively among all AI patent applicants in 2025.
Beyond the two superpowers, a meaningful second tier has emerged. Japan ranks third globally in AI patenting, leveraging its deep base of robotics expertise to advance industrial automation applications. Taiwan has quietly built a substantial AI patent portfolio, exceeding 10,000 AI-related patents by 2020, concentrated in semiconductors for AI acceleration, machine vision, and smart manufacturing. France leads continental Europe with roughly 4,900 AI patents, concentrated in computer vision, transportation, and defense applications, while the United Kingdom, with approximately 3,300 AI patents and strength in deep learning, fintech, and healthcare AI through DeepMind and its university research base, and Canada, with approximately 2,500 AI patents concentrated in natural language processing and autonomous vehicles through institutions such as the Vector Institute and MILA, round out the group of significant Western AI innovators. Within pharmaceuticals specifically, a distinct AI-patenting sub-race has emerged between large incumbent drug makers and a new generation of AI-native biotechs such as Recursion and the Alphabet-affiliated Insitro, several of which now match or exceed traditional pharmaceutical giants in AI-related filing activity despite their far smaller size.
3.3 Semiconductors
Semiconductor patenting sits at the intersection of several of the categories already discussed and has recently become one of the fastest-growing fields within international PCT filings, alongside digital communication. The United States retains substantial strength here through Qualcomm, ranked fourth among all global applicants at the European Patent Office and first in AI-related semiconductor patents, and Intel, ranked second globally in the semiconductor category specifically. However, manufacturing and process-technology leadership in semiconductors has become increasingly concentrated outside the United States, with Taiwan’s TSMC dominant in advanced-node chip fabrication and the Netherlands’ ASML holding an effective monopoly on the extreme ultraviolet lithography equipment without which the most advanced chips cannot be manufactured at all. South Korea’s Samsung Electronics, meanwhile, competes simultaneously as a leading memory-chip manufacturer and as one of the world’s largest patent filers across multiple technology categories.
This distribution, American design and architecture leadership, Taiwanese and South Korean manufacturing leadership, and Dutch equipment-monopoly leadership, is precisely why semiconductor supply chains have become a central subject of industrial and national security policy over the past several years. No single country currently controls the full semiconductor value chain from design through equipment through fabrication, and the patent data confirms that this fragmentation is not incidental but structural: each of the three or four leading jurisdictions holds a genuinely dominant, difficult-to-replicate position in a different stage of the same value chain.
3.4 Biotechnology and Pharmaceuticals
Biotechnology has been identified as one of the fastest-growing patent fields globally in the most recent WIPO technology outlook, with the convergence of artificial intelligence and biotechnology emerging as a particularly prominent driver of new filings. The field’s competitive structure differs meaningfully from semiconductors or digital communication: rather than being dominated by two or three global champions, biotechnology patenting, especially in China, is distributed across a large and fragmented population of small and medium biotechnology firms and university laboratories, producing a far less concentrated competitive landscape.
The United States and Europe both experienced a notable softening in traditional biotechnology and pharmaceutical patenting in the most recent reporting period even as overall patent activity grew: American-origin biotechnology filings at the EPO fell roughly 9 percent and pharmaceutical filings fell roughly 10 percent, while European-origin filings in the same two categories fell approximately 3 percent and 6 percent respectively. Medical technology, a related but distinct category covering devices and diagnostics rather than underlying biological or chemical compounds, grew modestly in both regions even as the core biotech and pharma categories contracted, suggesting that at least part of the recent softening reflects a genuine reallocation of research investment toward AI-enabled diagnostic and device technologies rather than a broad-based retreat from life sciences research.
3.5 Clean Energy, Batteries, and Automotive Transport
Clean energy and battery technology have emerged as one of the fastest-growing patent categories at the European Patent Office in the most recent reporting period, with Contemporary Amperex Technology (CATL) of China entering the top ten global applicants for the first time on the strength of its battery patent portfolio. This growth sits alongside Germany’s long-standing dominance in transport and industrial machinery patenting, the category in which German applicants file most intensively of any of the world’s top five origins, reflecting the country’s historic strength in internal combustion and, increasingly, electric vehicle powertrain engineering. Japan’s Toyota remains one of the world’s most prolific automotive patent filers, spanning both traditional combustion technology and hybrid and electric drivetrain systems, while South Korean and Chinese battery and electric-vehicle manufacturers have expanded their patent footprints rapidly over the past several years as global demand for electric vehicles and grid-scale energy storage has accelerated.
The Netherlands’ specialization in renewable energy technology, alongside its dominant semiconductor equipment position, illustrates how the clean-energy transition is generating entirely new pockets of patent leadership among mid-sized economies that were not traditionally associated with automotive or energy manufacturing. Taken together, the clean energy and transport category is currently the clearest example in the entire patent landscape of a field being reshaped in real time, with an incumbent German and Japanese industrial base being challenged simultaneously by Chinese battery manufacturers and by the broader global shift away from internal combustion technology.
3.6 Quantum Technologies
Quantum technology remains a small category in absolute filing terms but is growing faster than almost any other field tracked by major patent offices, expanding nearly 38 percent year-on-year in the most recent European Patent Office reporting period. This is a field still dominated by research institutions and a handful of specialized companies rather than the large industrial conglomerates that dominate semiconductors or automotive patenting, and it is one where the United States, China, and a cluster of European countries, Germany, the Netherlands, and the United Kingdom in particular, are all making early, deliberate strategic bets, given the field’s long-term implications for cryptography, materials science, and computational chemistry. Because quantum patenting is still at such an early stage relative to its eventual commercial significance, current filing leadership should be read as an indicator of research investment and strategic positioning rather than as a settled picture of eventual industrial dominance.
3.7 Aerospace, Defense, and Space Systems
Aerospace and defense patenting is concentrated among a smaller and more geopolitically sensitive set of countries than most of the other fields discussed in this essay, reflecting both the enormous capital requirements of the industry and the extensive export-control regimes that govern the transfer of aerospace and defense technology across borders. The United States remains the single largest source of aerospace and defense patents globally, driven by firms such as RTX, ranked among the top twenty applicants at the European Patent Office, Lockheed Martin, Boeing, and Northrop Grumman, alongside a dense ecosystem of specialized propulsion, avionics, and materials science suppliers. France maintains the strongest aerospace and defense patent base in continental Europe through Thales, Safran, and Dassault, reflecting a deliberate postwar national policy of maintaining independent aerospace and defense manufacturing capability, while the United Kingdom contributes significant patent activity through BAE Systems and Rolls-Royce, particularly in jet propulsion and materials engineering.
Space technology specifically has become an increasingly active patent category over the past decade, driven substantially by the emergence of private launch and satellite companies operating alongside traditional government space agencies. American firms lead this category by a wide margin, reflecting the country’s dominant position in commercial launch services and satellite manufacturing, though China’s state-directed space program has generated a rapidly growing volume of space-related patents concentrated in launch vehicle engineering and satellite communications, consistent with the country’s stated ambition to achieve parity with, and eventually surpass, American space capability over the coming decade. Russian space-related patenting, once a significant global category reflecting the Soviet Union’s pioneering role in the field, has declined substantially in recent years alongside the broader contraction in Russian patent filing activity discussed in Section 2.12.
3.8 Robotics and Industrial Automation
Robotics and industrial automation patenting is led overwhelmingly by Japan, whose applicants have built the deepest and most consistent patent base in this field of any country in the world, spanning industrial manufacturing robots, precision assembly systems, and, increasingly, humanoid and service robotics aimed at addressing the country’s demographic labor shortages. Japanese firms including Fanuc, Yaskawa Electric, and Kawasaki Heavy Industries anchor this specialization, alongside continued strength from the automotive manufacturers discussed in Section 3.5, whose vehicle assembly operations have historically been among the most sophisticated adopters and patent filers of industrial robotics technology anywhere in the world. South Korea has built a rapidly growing secondary position in this field, driven substantially by Samsung’s and LG’s manufacturing automation research, while Germany’s industrial machinery base, discussed in Section 2.5, contributes a significant European counterweight concentrated on precision manufacturing and automotive assembly automation specifically.
China has emerged as the fastest-growing source of robotics patents globally over the past several years, driven by a deliberate national strategy to reduce dependence on Japanese and Western industrial automation equipment and by the rapid growth of domestic robotics manufacturers serving the country’s enormous electronics and automotive assembly base. American robotics patenting, while smaller in absolute volume than Japan’s or China’s, is concentrated disproportionately in software and artificial-intelligence-enabled robotics control systems rather than in the mechanical and electromechanical hardware categories where Japan and Germany have traditionally led, a distinction that mirrors the broader pattern, discussed throughout Part Three, of American innovation leadership clustering around software and algorithmic layers of technology stacks rather than physical manufacturing and hardware layers.
3.9 Cybersecurity and Enterprise Software
Cybersecurity patenting has grown rapidly over the past decade as digital infrastructure has become simultaneously more central to economic activity and more exposed to state-sponsored and criminal attack. The United States leads this field by a wide margin, reflecting both the concentration of the world’s largest enterprise software and cloud computing companies within its borders and a mature venture-capital-funded cybersecurity startup ecosystem, with Microsoft, Google-parent Alphabet, and specialized security firms such as Palo Alto Networks and CrowdStrike among the most active filers. Israel maintains the second most significant cybersecurity patent base in the world relative to its population, as discussed in Section 2.10, built on a distinctive pipeline of talent trained within the country’s military intelligence and technology units before moving into commercial cybersecurity ventures. China has built a substantial and rapidly growing domestic cybersecurity patent base as well, though oriented more heavily toward state and critical-infrastructure security applications than toward the commercial enterprise security products that dominate American and Israeli filing activity.
3.10 Agricultural Technology and Food Science
Agricultural technology patenting, while smaller in absolute volume than most of the fields discussed elsewhere in this essay, is strategically significant given its direct connection to global food security, and its leadership is notably more geographically distributed than fields such as semiconductors or digital communication. The United States leads through a combination of large agribusiness firms and a deep public land-grant university research system focused on crop genetics, precision agriculture, and agricultural machinery. The Netherlands, despite its small size, has built one of the world’s most sophisticated agricultural technology research bases, reflecting the country’s position as the world’s second-largest agricultural exporter by value despite its limited land area, with particular strength in greenhouse technology, seed genetics, and vertical farming systems. Brazil has emerged as a significant source of agricultural biotechnology patents, consistent with its position as one of the world’s largest agricultural commodity exporters, while China’s agricultural patent activity has grown rapidly in recent years as the country pursues food security policies aimed at reducing dependence on imported grain and soybean supplies.
3.11 Medical Devices and Diagnostics
Medical technology, the category covering diagnostic and therapeutic devices rather than the underlying biological or chemical compounds covered by biotechnology and pharmaceutical patents, has grown steadily even as the more traditional biotech and pharma categories softened in the United States and Europe over the most recent reporting period, as discussed in Section 3.4. This growth is being driven substantially by the integration of artificial intelligence into diagnostic imaging, remote patient monitoring, and surgical robotics, fields in which the United States maintains clear leadership through firms such as Medtronic, Intuitive Surgical, and a dense ecosystem of medical-imaging AI startups, many building directly on foundational research from American academic medical centers. Germany and Switzerland maintain significant medical device patent bases as well, reflecting their broader strength in precision engineering and pharmaceuticals respectively, while Japan’s medical device industry, though smaller than its automotive and robotics sectors, benefits directly from the country’s deep precision manufacturing expertise discussed in Section 2.3.
Part Four — Corporate and Institutional Leadership
4.1 The World’s Largest Corporate Patent Filers
A small number of corporations account for a disproportionate share of the world’s most valuable patents. Huawei Technologies of China has been the single largest filer of published PCT applications every year since 2017, filing 7,523 applications in 2025 alone, nearly 60 percent more than its nearest rival. Samsung Electronics of South Korea ranks second with 4,698 applications, followed by Qualcomm of the United States, LG Electronics of South Korea with 2,400, and Panasonic of Japan. At the European Patent Office specifically, Samsung, Huawei, and LG have maintained their position as the top three applicants for consecutive years, with Nokia of Finland the fastest-growing major filer in the most recent period, climbing from twelfth to fifth place, and Microsoft and CATL both newly entering the top ten.
This corporate concentration matters because it means that national patent leadership is, in practice, often the story of one or two dominant firms rather than a broad-based national research ecosystem. China’s overall filing dominance owes an enormous debt to Huawei specifically; South Korea’s per-capita and per-GDP intensity owes a similar debt to Samsung and LG; and much of the recent softening in American life-sciences patenting sits alongside continued American strength in software and AI patenting driven substantially by Alphabet, Microsoft, and Qualcomm. Understanding a country’s patent position, in other words, requires looking beneath the national aggregate to the handful of corporate champions actually generating the bulk of that country’s filings.
4.2 Universities and Research Institutions
Universities remain significant patent filers in their own right, particularly in the United States, where the University of California system is ranked the most prolific university patent filer in the world, with MIT and Stanford close behind. This American university strength is a direct legacy of the 1980 Bayh-Dole Act, which gave American universities ownership rights over inventions developed using federal research funding and created powerful financial incentives for university technology-transfer offices to patent and license faculty research aggressively. No other country has replicated this model at comparable scale, though Chinese universities have become an increasingly important source of the country’s fragmented biotechnology patent base, filing in far greater numbers than their American counterparts even if the average commercial value of individual university filings remains, by most assessments, lower than that of top American research universities.
4.3 Non-Practicing Entities and the Market for Patent Rights
A distinct category of patent activity involves non-practicing entities (NPEs), organizations that hold patents without manufacturing products themselves, generating revenue instead through licensing and litigation. The United States and Japan dominate this category, together accounting for nearly 47 percent of all non-practicing-entity patent activity initiated worldwide, with American-resident applicants initiating roughly 194,000 such filings in the most recent reporting year and Japanese-resident applicants roughly 133,000. China, Germany, and South Korea round out the top five origins for this activity. Asia as a whole has become the leading region for internationally filed non-practicing-entity patents, initiating close to 40 percent of the global total, a share that has grown meaningfully over the past decade and mirrors the broader Asian ascendency seen across every other patent category discussed in this essay.
Part Five — Strategic Implications and Outlook
5.1 What the Data Says About National Innovation Strategy
Read together, these patterns support several durable conclusions about how countries actually build innovation leadership. First, sustained state-level industrial policy works: South Korea’s multi-decade transformation and China’s more recent, faster ascent both reflect deliberate government strategies that embedded patenting targets directly into corporate and academic incentive structures, rather than treating patent output as an incidental byproduct of unrelated research spending. Second, volume and value are genuinely different achievements that do not always move together: China’s overwhelming lead in raw filing counts coexists with continued American leadership in filings abroad and in several of the most commercially significant technology categories, meaning that a country can lead the world in innovative activity by one measure while trailing by another. Third, specialization compounds: countries that concentrate their national research effort in a narrow set of fields, Dutch semiconductor lithography equipment, Swiss pharmaceuticals and precision instruments, Taiwanese chip fabrication, Nordic telecommunications, often achieve global dominance in that narrow field even with a small total population and modest aggregate filing volume, a lesson with direct relevance for any organization or economy seeking to build innovation capacity without the scale of China, the United States, or the European Union behind it.
5.2 Risks and Open Questions
Several open questions complicate any straightforward reading of the patent data. Chinese filing volume, while enormous, still includes a meaningful tail of lower-quality domestic filings driven by local subsidy incentives, meaning that raw counts likely overstate China’s lead relative to a hypothetical quality-adjusted measure, even as the country’s rising share of PCT filings, EPO filings, and biotechnology patents all suggest that the quality gap is narrowing over time. American patent leadership, meanwhile, is increasingly concentrated in software, AI, and a small number of large technology companies, raising a longer-term question about whether the United States is ceding ground in physical-world manufacturing and life-sciences innovation even as it retains clear leadership in digital and computational fields. Geopolitical classification issues, most visibly Taiwan’s exclusion from standard WIPO country rankings despite its outsized real-world importance to global semiconductor innovation, are a reminder that patent statistics, however useful, are ultimately built on a national accounting framework that does not always map cleanly onto the way modern, deeply globalized supply chains and research collaborations actually function.
5.3 Outlook
Every major trend documented in this essay points toward continuation rather than reversal over the medium term. Asia’s share of global patent filings is very unlikely to fall back toward its 2014 level of 60 percent; if anything, continued double-digit growth from India alongside sustained Chinese and South Korean expansion suggests Asia’s share may climb still further before it plateaus. Artificial intelligence, semiconductors, biotechnology, and clean-energy and battery technology are the four fields most analysts agree will define the next decade of global patent competition, and each already shows a genuinely multipolar structure: American software and design leadership, Asian manufacturing and volume leadership, and a handful of specialized European players holding indispensable, difficult-to-replicate positions within specific technology niches. For policymakers, investors, and organizations building long-term research and development strategy, the clearest lesson from the global patent record is that innovation leadership is neither permanent nor monolithic: it is built deliberately, over decades, through sustained investment and institutional design, and it is currently being contested more actively, across more countries and more technology fields simultaneously, than at any point in the modern history of the patent system.
2.9 The United Kingdom, France, and the Rest of Western Europe
The United Kingdom remains one of the ten largest sources of patent applications in the world, anchored by a research base that spans pharmaceuticals, aerospace, and financial technology, and by a university and research-hospital system that continues to produce world-class biomedical and computing research even as the country’s overall share of global filings has declined alongside the rest of Western Europe. British strength in artificial intelligence is particularly notable given the country’s modest population, driven substantially by DeepMind, the London-based AI research laboratory now owned by Alphabet, and by a dense cluster of university spinouts around Oxford, Cambridge, and Imperial College London working on deep learning, fintech applications, and healthcare diagnostics. The UK’s Glaxo Group and AstraZeneca remain among the most significant pharmaceutical patent filers in Europe, giving the country a genuine second pillar of strength in life sciences alongside its digital and AI base.
France stands as continental Europe’s leading source of AI patents outside Germany, with roughly 4,900 AI-related patents concentrated in computer vision, transportation, and defense applications, reflecting the country’s historic strength in aerospace and defense engineering through firms such as Thales, Safran, and Dassault, alongside a growing civilian AI research base centered on Paris. French cosmetics and consumer goods group L’Oréal has also built an unusual form of intellectual property leadership: it has been the single largest filer under WIPO’s Madrid trademark system for five consecutive years, a reminder that patent leadership in engineering and biotechnology sits alongside a parallel and equally significant contest over trademark and brand protection in consumer-facing industries. Beyond France and the UK, Belgium, Austria, and Italy round out a second tier of Western European economies with meaningful but comparatively modest patent output, generally concentrated in chemicals, industrial machinery, and specialty manufacturing, sectors inherited from each country’s twentieth-century industrial base.
2.10 Israel: The Concentrated Innovation Economy
Israel represents one of the most concentrated and internationally oriented innovation economies in the world relative to its small population, built on a distinctive combination of mandatory military technology service, a dense venture-capital ecosystem, and deep research ties to leading American universities and technology companies. Israeli patent activity is heavily weighted toward cybersecurity, semiconductor design, medical devices, and enterprise software, and a disproportionate share of Israeli-origin patents are filed directly abroad, particularly in the United States, rather than only domestically, reflecting the export-oriented and multinational structure of the country’s technology sector, where many locally developed inventions are commercialized through subsidiaries or acquisitions by larger American and European technology firms. Intel’s Israeli research and development centers, among the company’s largest outside the United States, and a dense concentration of cybersecurity firms around Tel Aviv and Herzliya, illustrate how a small country can achieve outsized global technological influence through deliberate specialization rather than breadth.
2.11 Canada, Australia, and the Commonwealth Innovation Belt
Canada has built a distinctive and increasingly influential position in artificial intelligence research, with roughly 2,500 AI-related patents concentrated in natural language processing, autonomous vehicles, and healthcare applications, anchored by research institutions such as the Vector Institute in Toronto and MILA in Montreal, both of which have trained a disproportionate share of the researchers who went on to lead major American and European AI laboratories. Canadian strength in AI research talent has not yet fully translated into commensurate patent volume, since much of the country’s most significant research is commercialized by American parent companies rather than filed under Canadian corporate ownership, a pattern that illustrates how patent statistics can understate a country’s true research contribution when its talent and intellectual property are absorbed into larger multinational corporate structures headquartered elsewhere.
Australia’s patent activity is comparatively modest in global terms but concentrated usefully in mining technology, agricultural biotechnology, and medical devices, reflecting the country’s natural resource base and a well-funded public university research system. New Zealand contributes a small but notable agricultural and biotechnology patent base relative to its population, particularly in dairy processing technology and agricultural genetics. Neither country ranks among the global top twenty by absolute filing volume, but both maintain patent-to-GDP intensities that place them solidly within the upper-middle tier of developed economies, consistent with their broader profile as resource-rich, well-educated, but population-constrained innovation economies.
2.12 Russia and the Commonwealth of Independent States
Russian patent filing activity has declined significantly since 2022, a trend widely attributed to the country’s international isolation following sanctions and the departure of numerous multinational corporations that had previously filed jointly with Russian research partners. Russian-origin patents remain concentrated in defense-related engineering, nuclear technology, and space systems, sectors inherited from the Soviet-era research establishment and sustained today primarily through state-owned enterprises such as Rosatom and Roscosmos rather than through a broad-based private innovation economy. Kazakhstan has emerged as the most dynamic patent filer within the wider Commonwealth of Independent States region, posting utility model filing growth above 30 percent in the most recent reporting year, concentrated in agricultural technology and mineral processing, a pattern consistent with the country’s economic diversification strategy away from pure commodity export.
2.13 Southeast Asia and the ASEAN Innovation Corridor
Singapore stands out within Southeast Asia as a genuinely globalized innovation hub, with patent activity concentrated in biotechnology, financial technology, and advanced manufacturing, supported by a research infrastructure built substantially around the National University of Singapore, Nanyang Technological University, and the government’s Agency for Science, Technology and Research. Singapore’s small population means its absolute filing volume remains modest, but its patent-to-GDP intensity and its role as a regional headquarters location for multinational research and development operations give it an influence on regional innovation policy well beyond what its raw statistics suggest. Vietnam, Thailand, Indonesia, and Malaysia have each posted meaningful multi-year growth in both patent and utility model filings, generally concentrated in electronics assembly, agricultural technology, and, in Vietnam’s case specifically, an increasingly sophisticated electronics manufacturing base built on foreign direct investment from South Korean and Chinese firms relocating supply chains out of China. None of these economies yet rivals the innovation intensity of Northeast Asia, but the consistent regional growth trend suggests Southeast Asia is positioning itself as the next tier of Asian economies to watch as global manufacturing and, increasingly, research and development activity continues to diversify within the region.
2.14 The Middle East and Africa
Beyond Israel, the wider Middle East’s most significant patent activity comes from the Islamic Republic of Iran, which filed over 8,400 patent applications in 2024, nearly all of them, 98.6 percent, from domestic resident applicants, reflecting a research system oriented toward import substitution and domestic industrial self-sufficiency amid ongoing international sanctions, with particular strength in petrochemicals, agricultural biotechnology, and pharmaceuticals. The Gulf Cooperation Council states, led by the United Arab Emirates and Saudi Arabia, have begun investing heavily in patent-generating research infrastructure as part of broader economic diversification strategies away from oil dependency, particularly in renewable energy, artificial intelligence, and biotechnology, though filing volumes from the region remain small in absolute global terms as these investments are still in a relatively early stage of maturation.
On the African continent, South Africa remains the most consistent source of patent filings, with a research base concentrated in mining technology, biotechnology, and renewable energy, supported by a network of public universities and the Council for Scientific and Industrial Research. Kenya has posted the fastest utility model growth rate of any tracked origin globally in the most recent reporting year, at 51 percent, driven by a rapidly expanding mobile technology and agricultural innovation ecosystem centered on Nairobi, often described as one of the continent’s most dynamic technology hubs. Nigeria and Egypt contribute meaningful but still modest patent activity relative to their populations, concentrated in agricultural technology and telecommunications. The African Regional Intellectual Property Organization (ARIPO) and the African Intellectual Property Organization (OAPI) provide regional filing mechanisms intended to lower the cost of multi-country protection for African inventors, though the continent’s combined share of global filings, together with Latin America and Oceania, remains only about 3 percent of the world total, underscoring how much room remains for African innovation systems to grow relative to the continent’s population and economic potential.
Part Six — Comparative Data Tables
6.1 Top Ten Countries by Total Patent Application Volume (Origin Basis, 2024)
The following ranking reflects total patent applications filed worldwide by applicants resident in each country, combining domestic and foreign filings, and illustrates the scale of China’s lead over every other origin. 1. China — approximately 1.8 million applications. 2. United States — approximately 502,000 applications. 3. Japan — approximately 419,000 applications. 4. Republic of Korea — approximately 296,000 applications. 5. Germany — approximately 133,000 applications. 6. India — strong double-digit growth for a sixth consecutive year, though still well behind the top five in absolute terms. 7. United Kingdom — a stable top-ten position sustained by pharmaceuticals, aerospace, and digital technology. 8. France — sustained by aerospace, defense, and luxury-goods innovation. 9. Switzerland — high absolute volume relative to its small population, concentrated in pharmaceuticals and precision instruments. 10. Netherlands — sustained substantially by ASML and a globally networked corporate research base.
6.2 Top Countries by Patents Per Capita (2024)
This measure adjusts for population size and rewards small, research-intensive economies. 1. Republic of Korea — approximately 3,783 patents per million inhabitants. 2. Japan — approximately 1,913 per million. 3. Switzerland — approximately 1,235 per million. 4. China — ranks fourth on this adjusted measure despite leading on raw volume. 5. Germany, Sweden, Finland, and Denmark — cluster closely together in the next positions, reflecting the broader Northern European pattern of high research intensity relative to population.
6.3 Top Global Corporate Patent Filers (PCT Applications, 2025)
1. Huawei Technologies (China) — 7,523 applications. 2. Samsung Electronics (Republic of Korea) — 4,698 applications. 3. Qualcomm (United States). 4. LG Electronics (Republic of Korea) — 2,400 applications. 5. Contemporary Amperex Technology, CATL (China). Close behind this top five sit Panasonic (Japan), Ericsson (Sweden), Nokia (Finland), Intel (United States), and Toyota (Japan), together forming the group of ten corporations that most consistently anchor the world’s highest-value international patent filings year after year.
6.4 Sector Leadership Summary
Digital communication and 5G infrastructure: led by China, through Huawei, with Sweden’s Ericsson and Finland’s Nokia as the leading Western challengers. Artificial intelligence, by volume: led by China; by commercial value and software architecture: led by the United States, through Alphabet, Microsoft, and Qualcomm. Semiconductor design: led by the United States, through Qualcomm and Intel. Semiconductor manufacturing: led by Taiwan, through TSMC, and the Republic of Korea, through Samsung. Semiconductor equipment: led by the Netherlands, through ASML, in an effective global monopoly on extreme ultraviolet lithography. Biotechnology: led by the United States and China, with China’s activity distributed across a large population of smaller firms and universities rather than concentrated in a handful of national champions. Pharmaceuticals: led by the United States, Switzerland, and the United Kingdom, through Pfizer, Roche, Novartis, and GSK-lineage firms. Automotive and transport: led by Germany and Japan, through Toyota, alongside rapidly growing Chinese electric-vehicle and battery manufacturers. Batteries and clean energy storage: led by China, through CATL, with South Korean and Japanese battery manufacturers close behind. Quantum technologies: an early-stage, research-driven field currently led jointly by the United States, China, Germany, and the United Kingdom.
Part Seven — Governance, Investment, and Organizational Implications
7.1 Reading Patent Data as an Investment Signal
For investors and capital allocators, patent trend data offers a genuinely useful, if imperfect, early signal of where corporate and national research investment is flowing before that investment shows up in revenue or earnings. A company or country whose patent filings in a given technology field are growing consistently faster than its overall filing base, as with China and battery technology, or the United States and artificial intelligence software, is signaling a deliberate reallocation of research resources toward that field years before the resulting products reach mass commercial scale. Conversely, a sustained multi-year decline in filings, as seen recently in American and European biotechnology and pharmaceutical patenting even amid overall patent growth, can signal either a genuine retreat from a field or, as appears more likely in this specific case, a reallocation of research effort toward adjacent, faster-growing categories such as AI-enabled diagnostics, a distinction that requires careful sector-level analysis rather than a single top-line number.
7.2 Implications for Governance and Institutional Strategy
For governments and large institutions engaged in long-term strategic planning, the clearest lesson from the global patent record is that innovation leadership is a deliberately constructed institutional outcome rather than an automatic byproduct of economic size. South Korea and, more recently, China each built patent leadership through explicit, sustained policy choices: tying research funding, corporate incentives, and university performance metrics directly to patenting and commercialization outcomes over a period of decades rather than years. Organizations and economies without China’s or the United States’ scale, such as Switzerland, the Netherlands, Finland, Singapore, and Israel, have nonetheless achieved genuine global leadership by concentrating limited research resources into a small number of carefully chosen, defensible technology niches rather than attempting to compete broadly across every field simultaneously. This is arguably the single most transferable lesson from the entire global patent landscape for any organization, however large or small, seeking to build durable, internationally recognized research and technology capability: sustained focus, backed by patient multi-year investment and institutional incentive design, consistently outperforms broad but shallow research effort.
7.3 Closing Reflections
The patent record examined throughout this essay is, in the end, a record of choices made and sustained over long periods of time: China’s choice to embed patenting into local governance incentives beginning in the early 2000s, South Korea’s choice to build patent output directly into corporate industrial policy beginning in the 1970s, the Netherlands’ choice to concentrate a small country’s research resources into a single, globally indispensable technology niche, and the United States’ continued, if increasingly contested, choice to protect and reward university-based and corporate research through one of the world’s oldest and most litigated intellectual property systems. As the global innovation landscape continues to shift toward a genuinely multipolar structure over the coming decade, spanning American software leadership, Asian manufacturing and volume leadership, and specialized European niches, the countries and organizations that will lead the next chapter of this story will very likely be those that make equally deliberate choices today, backed by the patience to sustain them over the multi-decade horizon that every successful example in this essay required.
Part Eight — Five Corporate Case Studies
8.1 Huawei Technologies: The World’s Largest Individual Patent Filer
Huawei’s position as the world’s largest single filer of international patent applications for nine consecutive years is arguably the single most important corporate data point in the entire global patent landscape, since it demonstrates that a single Chinese telecommunications equipment maker now files more high-value international patents each year than the next largest filer by a margin of nearly 60 percent. Huawei’s patent strategy is built substantially around fifth-generation mobile communication standards and the broader digital communication category discussed in Section 3.1, where the company has spent over two decades building one of the world’s largest portfolios of standard-essential patents, positions that generate ongoing licensing revenue from virtually every telecommunications equipment maker and smartphone manufacturer in the world regardless of that competitor’s country of origin. Huawei’s continued patent leadership despite the extensive American export restrictions imposed on the company since 2019 illustrates an important distinction between patent filing activity and market access: Huawei has continued to invest heavily in research and to file for intellectual property protection even in markets where it faces severe commercial restrictions, suggesting the company views patent leadership as a long-term strategic asset independent of its immediate commercial fortunes in any single national market.
8.2 Taiwan Semiconductor Manufacturing Company: The Indispensable Foundry
TSMC occupies a position in the global semiconductor supply chain with few parallels anywhere else in the modern economy: it manufactures the large majority of the world’s most advanced logic chips, including the processors that power most modern smartphones, the most advanced artificial intelligence training hardware, and a large share of automotive and industrial semiconductors, for customers who themselves do not operate their own advanced chip fabrication facilities, including Apple, Nvidia, and Qualcomm. TSMC’s patent portfolio is concentrated overwhelmingly in advanced-node semiconductor process technology, the highly specialized manufacturing techniques required to produce chips at the smallest and most efficient transistor scales currently achievable, an area in which the company’s process expertise is widely regarded as at least a full generation ahead of its nearest competitors. Taiwan’s broader exclusion from standard WIPO country rankings, discussed in Section 2.7, means that TSMC’s enormous individual patent portfolio does not register in most international country-level comparisons in the way its real-world significance would suggest it should, a genuine limitation of country-level patent statistics as a complete picture of global technological capability.
8.3 ASML: The Single Point of Failure in Global Chip Manufacturing
ASML of the Netherlands holds what is, in practical terms, a global monopoly on extreme ultraviolet lithography equipment, the machines required to etch the smallest and most advanced transistor patterns onto silicon wafers, a position built over more than two decades of sustained research investment and now protected by a patent portfolio so extensive and technically demanding that no competitor has yet managed to replicate the underlying technology despite the enormous commercial incentive to do so. ASML’s position illustrates, more clearly than perhaps any other single company discussed in this essay, how a small country can translate concentrated, patient, multi-decade research investment into genuinely irreplaceable global technological leverage: the Netherlands’ broader specialization in semiconductors, discussed in Section 2.5, is substantially a story of this one company’s sustained technical dominance in a single, extraordinarily narrow but globally indispensable manufacturing niche.
8.4 Samsung Electronics: The Diversified Patent Powerhouse
Samsung Electronics stands apart from the other companies profiled in this section in the sheer breadth of its patent portfolio, ranking among the world’s largest filers simultaneously in semiconductors, where it competes as one of the world’s leading memory-chip manufacturers, consumer electronics, mobile devices, and digital displays. This breadth reflects South Korea’s broader national strategy, discussed in Section 2.4, of embedding aggressive patent filing directly into the operations of its largest industrial conglomerates, and Samsung alone accounts for a substantial share of South Korea’s overall position as the world’s most patent-intensive major economy on a per-capita basis. Samsung’s consistent position among the top three applicants at the European Patent Office, alongside Huawei and LG, for consecutive years underscores that the company’s patent strategy is not limited to its home market or to any single product category, but spans essentially every major technology field in which the broader Samsung corporate group competes globally.
8.5 Toyota Motor Corporation: A Century of Compounding Automotive Innovation
Toyota’s patent portfolio represents one of the longest continuously compounding bodies of industrial research in the modern global economy, spanning traditional internal combustion engineering, the hybrid powertrain technology the company pioneered commercially in the late 1990s, and an increasingly significant electric vehicle and battery technology portfolio developed in response to competitive pressure from Chinese electric-vehicle manufacturers and battery makers such as CATL, discussed in Section 3.5. Toyota’s continued position among the world’s most prolific automotive patent filers, alongside Panasonic and Sony as one of Japan’s flagship corporate patent leaders discussed in Section 2.3, illustrates the broader Japanese pattern of prioritizing sustained patent quality and commercial value over the sheer filing volume pursued by Chinese competitors, even as the global automotive industry undergoes what is widely regarded as its most significant technological transition since the original shift from horse-drawn transport to the internal combustion engine over a century ago.
Part Nine — Beyond Patents: Trademarks, Industrial Designs, and the Broader Intellectual Property Picture
9.1 Trademark Filing Leadership
While this essay has focused overwhelmingly on patents as the clearest available proxy for scientific and technological leadership, a complete picture of national intellectual property strength requires at least a brief look at the two other major categories WIPO tracks: trademarks and industrial designs. China leads the world by an enormous margin in trademark filings as well as patents, reflecting both its manufacturing scale and a domestic corporate culture that treats brand registration as a routine part of doing business, though the average commercial significance of an individual Chinese trademark filing is generally regarded as lower than that of filings from established Western consumer brands. The United States and the European Union, through its unified trademark system, remain the leading sources of internationally significant trademark filings by commercial value, driven by the enormous global brand portfolios of American technology and consumer companies and European luxury, automotive, and food and beverage brands.
At the level of individual filers, France’s L’Oréal has held the position of the single largest filer under WIPO’s Madrid international trademark system for five consecutive years, an unusual and instructive data point given that the company is not primarily known as a technology innovator in the patent sense discussed throughout this essay, but rather as a brand-protection-intensive consumer goods company operating across dozens of national markets simultaneously. Light & Wonder of the United States, a gaming technology company, posted the most dramatic rise in the most recent Madrid System rankings, climbing 38 places to become the second-largest filer, while Huawei Technologies’ appearance among the top five Madrid filers demonstrates that the company’s intellectual property strategy extends well beyond the patent portfolio discussed at length in Section 8.1 to encompass an equally aggressive approach to global brand protection.
9.2 Industrial Design Filings
Industrial design registrations, which protect the visual appearance rather than the technical function of a product, follow a filing pattern broadly similar to patents, with Asia accounting for the overwhelming majority of global filings and China alone responsible for the largest single share. This category is of particular strategic significance in consumer electronics, automotive, and furniture and consumer goods industries, where the visual design of a product is often as commercially significant as its underlying technical function, and companies in these industries frequently file design registrations alongside utility patents to protect the same product from multiple angles simultaneously. South Korea and Japan maintain particularly strong industrial design filing bases relative to their populations, consistent with both countries’ broader cultural and corporate emphasis on product aesthetics as a core element of competitive differentiation in consumer electronics and automotive markets.
9.3 Reading the Three Categories Together
Taken together, patents, trademarks, and industrial designs offer a more complete picture of a country’s or company’s overall intellectual property strategy than any single category alone. A country or company that leads in patents but not trademarks, as is broadly true of Germany relative to its trademark position, is signaling a strategy weighted toward protecting underlying technical innovation, often in business-to-business or industrial contexts where brand recognition matters less than technical performance. A country or company that leads in trademarks relative to its patent position, as is broadly true of France’s luxury goods sector relative to its more modest patent volume outside aerospace and AI, is signaling a strategy weighted toward protecting brand equity and consumer recognition in markets where the underlying product technology may be more widely shared across competitors. The most sophisticated global technology companies, Huawei and Samsung foremost among them, increasingly pursue genuinely comprehensive strategies across all three categories simultaneously, reflecting the reality that modern competitive advantage rarely rests on technology, brand, or design alone, but on some carefully constructed combination of all three.
Part Ten — A Decade in Review: Key Turning Points, 2014 to 2025
2014: Asia’s share of global patent filings stands at 60 percent, with China’s national office responsible for approximately 35 percent of world filings, a substantial but not yet overwhelming share; Japan’s patent-to-population ratio, at 2,090 per million, sits meaningfully above its 2024 level, reflecting a domestic filing intensity that has since declined alongside the country’s aging population.
2017: Huawei Technologies files its way to becoming the world’s largest single filer of published PCT applications for the first time, a position it has held in every subsequent year through 2025, marking the point at which a single Chinese corporation’s international patent strategy became large enough to reshape global corporate filing rankings on its own.
2019: The United States imposes extensive export restrictions on Huawei, testing whether the company’s continued patent leadership can be sustained under severe commercial constraints in one of its most important historical markets; Huawei’s patent filing activity continues largely uninterrupted in the years that follow, demonstrating the degree to which the company’s research and intellectual property strategy operates on a planning horizon substantially independent of near-term market access decisions in any single country.
2020 to 2021: Global patent filing activity proves broadly resilient through the disruption of the COVID-19 pandemic, with biotechnology and pharmaceutical patenting in particular accelerating as vaccine and therapeutic research intensified worldwide, a surge that partially explains the subsequent softening in biotechnology and pharmaceutical filings discussed in Section 3.4 as some pandemic-driven research investment normalized in the years that followed.
2022: Russian patent filing activity begins a sustained decline following the country’s invasion of Ukraine and the resulting sanctions regime and departure of numerous multinational corporations that had previously filed jointly with Russian research partners, a pattern discussed at greater length in Section 2.12.
2023 to 2024: China’s share of global patent filings, at the level of its national office specifically, reaches 49.1 percent, effectively half of all patent applications filed anywhere on earth in a single year; India posts its sixth consecutive year of double-digit patent filing growth, the longest sustained acceleration of any major emerging economy tracked throughout this period.
2025: China becomes the third-largest country of origin for patent applications filed at the European Patent Office for the first time in the EPO’s history, overtaking Germany; the Republic of Korea extends its unbroken streak of annual PCT filing growth to 28 consecutive years, the longest such streak of any major economy; quantum technology patent filings grow nearly 38 percent year-on-year at the European Patent Office, the fastest growth rate of any tracked technology category; artificial intelligence patenting at the EPO grows 9.5 percent, continuing several consecutive years of acceleration in the field.
2026: Demand for European patents exceeds 200,000 applications in a single year for the first time in the European Patent Office’s history, even as the United States, Germany, and Japan each continue multi-year declines in their own PCT filing volumes, illustrating the continued global expansion of formal patent activity even as its center of gravity keeps shifting toward Asia.
Frequently Asked Questions
Which single country files the most patents in the world?
China, by a wide margin, both in terms of applications received by its national office, the China National Intellectual Property Administration, and in terms of total applications filed worldwide by Chinese-origin applicants, at approximately 1.8 million in 2024, nearly three-and-a-half times the volume of the second-place United States.
Which country produces the highest-value, most commercially significant patents?
By the most widely used proxy for patent value, applications filed abroad, the United States leads the world and has done so every year since 2013, reflecting the country’s continued strength in software, artificial intelligence, and high-value technology commercialization even as its total filing volume has fallen relative to China’s.
Which country is most patent-intensive relative to its population?
The Republic of Korea, at approximately 3,783 patents per million inhabitants in 2024, more than double the rate of second-place Japan and roughly triple that of third-place Switzerland.
Which single company files the most international patents?
Huawei Technologies of China, which has been the world’s largest filer of published PCT applications every year since 2017, filing 7,523 applications in 2025 alone.
Which country leads specifically in artificial intelligence patents?
By raw volume, China leads decisively, accounting for over 70 percent of all AI-related patent applications filed globally by 2025. By commercial value and software architecture specifically, the United States leads through Alphabet, Microsoft, and Qualcomm, which rank first, fourth, and fifth respectively among all AI patent applicants at the European Patent Office.
Why is Taiwan excluded from most official patent country rankings?
Taiwan’s exclusion from standard WIPO country-level statistics reflects its unique diplomatic status as a non-member of the United Nations rather than any deficiency in its patent activity; when Taiwan Intellectual Property Office data is examined independently, the island’s filing volume would place it among the world’s top six countries by raw count and second globally on a per-capita basis, and its semiconductor manufacturing leadership through TSMC makes it one of the two or three most consequential single locations on earth for that specific technology field regardless of its exclusion from formal country rankings.
Glossary of Key Terms
Patent application: a formal request filed with a national or regional intellectual property office seeking legal protection for an invention, examined by that office before being granted or refused. Patent grant: a patent application that has been formally approved and now confers enforceable legal rights on its holder. Utility model: a lighter-weight, faster, and less rigorously examined form of intellectual property protection available in many countries, offering a shorter term of protection than a full patent and used heavily by smaller firms and individual inventors, particularly in China, Germany, and several emerging economies. Patent Cooperation Treaty (PCT): an international treaty, administered by WIPO, allowing an applicant to file a single international application that can later be extended into national or regional protection across up to 158 member countries, widely used as a proxy for high commercial value invention given the cost involved in filing this way. Origin data: patent statistics attributed to the country of residence of an application’s first-named applicant, regardless of which national office received the filing, used throughout this essay to answer the question of where inventive activity is actually occurring. Office data: patent statistics attributed to the specific national or regional office that received an application, regardless of the applicant’s nationality. Patents in force: the total accumulated stock of patents that remain legally valid and enforceable at a given point in time, as distinct from the annual flow of new applications. Standard-essential patent (SEP): a patent covering technology that has been incorporated into an internationally adopted technical standard, such as a mobile communication standard, entitling its holder to licensing revenue from any company implementing that standard. Non-practicing entity (NPE): an organization that holds patents without manufacturing products itself, generating revenue instead through licensing agreements or infringement litigation. Patent family: the complete set of related patent applications and grants covering a single underlying invention across multiple countries, often used by patent offices as a more accurate unit of comparison than raw application counts since it avoids double-counting a single invention protected in many jurisdictions.
Appendix: Regional Summary and the Innovation-to-Development Correlation
A.1 Asia-Pacific
Asia-Pacific now accounts for just over 70 percent of all patent applications filed worldwide, concentrated overwhelmingly in four jurisdictions, China, Japan, the Republic of Korea, and India, which together represent over 95 percent of the region’s total filings. The region’s dominance spans nearly every technology category examined in Part Three, from digital communication and computer technology, where China leads, to robotics and automotive engineering, where Japan and South Korea lead, and it is the only major world region whose share of global filings has grown consistently, rather than declined, over the past decade.
A.2 North America
North America’s share of global patent filings has fallen from roughly 23 percent in 2014 to 17 percent in 2024, driven almost entirely by the relative, rather than absolute, decline of the United States as China’s filing volume has grown far faster than America’s own. Despite this declining share, North America, and the United States specifically, retains clear leadership in the categories most directly tied to commercial value and technological frontier research: artificial intelligence software, cybersecurity, university-based research commercialization, and applications filed abroad, the proxy measure most closely associated with high-value invention.
A.3 Europe
Europe’s share of global filings has fallen from just under 13 percent in 2014 to under 10 percent in 2024, yet the region continues to lead in eight of the ten largest technology fields tracked at the European Patent Office when European-origin applicants are considered as a bloc, reflecting Europe’s continued strength in transport and industrial machinery through Germany, pharmaceuticals and precision instruments through Switzerland, semiconductor equipment through the Netherlands, and a broad base of aerospace, luxury goods, and financial technology innovation spread across France, the United Kingdom, and the Nordic countries.
A.4 Latin America, Africa, and Oceania
These three regions combined account for only about 3 percent of global patent filings, a share that has itself declined slightly over the past decade even as individual countries within the group, Brazil, Turkey, Kenya, and South Africa foremost among them, have posted strong percentage growth from a low base, particularly in the lighter-weight utility model category. This combined figure represents the clearest remaining gap in the global innovation landscape relative to population and economic potential, and the sustained multi-year growth trend in several of these individual countries suggests a gradual, if still early-stage, broadening of the base of nations meaningfully engaged in formal patenting activity.
A.5 The Innovation-to-Development Correlation
Across every region examined in this essay, patent intensity, whether measured per capita or relative to GDP, correlates closely with a country’s position on standard measures of economic development, but the relationship is not simply a matter of wealth alone. Several of the world’s most patent-intensive economies by these adjusted measures, South Korea, Japan, Switzerland, Finland, and Israel, are not the world’s largest economies in absolute terms, but each has built a national research and development ecosystem deliberately structured around translating scientific investment into formally protected intellectual property, a pattern this essay has referred to throughout as institutional design rather than accident. Conversely, several middle-income economies with meaningful populations and growing overall economic output, across Africa, Latin America, and parts of Southeast Asia, remain far below the innovation intensity their development level might otherwise predict, suggesting that patent intensity is a genuinely distinct national capability, built through deliberate policy and institutional choices over long periods of time, rather than an automatic byproduct of economic growth alone.
A.6 A Note on Interpreting Rankings Over Time
Readers returning to this essay in future years should treat every specific figure cited above as a snapshot of a fast-moving landscape rather than a permanent ranking. The single clearest lesson of the past decade of patent statistics is that positions widely assumed to be stable, the United States’ historic dominance in raw filing volume, Japan’s twentieth-century position as the presumptive number-two global innovator, or Germany’s unchallenged position as the largest European source of patents at the EPO, have each been overtaken within a relatively short span of years once a rival economy committed to sustained, multi-decade investment in research and patenting infrastructure. The same dynamic should be expected to continue reshaping today’s rankings: India’s sustained double-digit growth, the continued rise of Southeast Asian manufacturing economies, and the early but rapidly accelerating patent activity emerging from Gulf Cooperation Council states all represent plausible sources of the next major shift in global patent leadership, and any organization using this essay for long-term strategic planning should expect, and plan for, continued change rather than a static picture of who leads where.
Sources and Data Notes
This essay draws on the World Intellectual Property Organization’s World Intellectual Property Indicators 2025 and IP Facts and Figures 2025 publications, WIPO’s PCT Yearly Review 2025 and its 2026 international filings press release, the European Patent Office’s Technology Dashboard 2025 (formerly the EPO Patent Index), the United States Patent and Trademark Office’s fiscal year 2025 grant data as compiled in independent patent-analytics roundups, and supplementary reporting on artificial intelligence patent trends by technology-sector analysts. Figures reflect the most recently published data available as of mid-2026 and are drawn primarily from the WIPO Statistics Database as of September 2025, supplemented by more recent 2025 filing-year data released by WIPO and the EPO in early 2026. Readers should note that patent statistics are inherently backward-looking by twelve to eighteen months due to standard publication and examination timelines, and that origin data, filings attributed to an applicant’s country of residence, are treated by WIPO itself as a baseline estimate rather than a fully complete count, since some national offices report only aggregate totals without an origin breakdown.



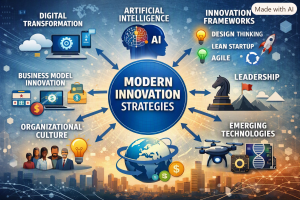


Be First to Comment