
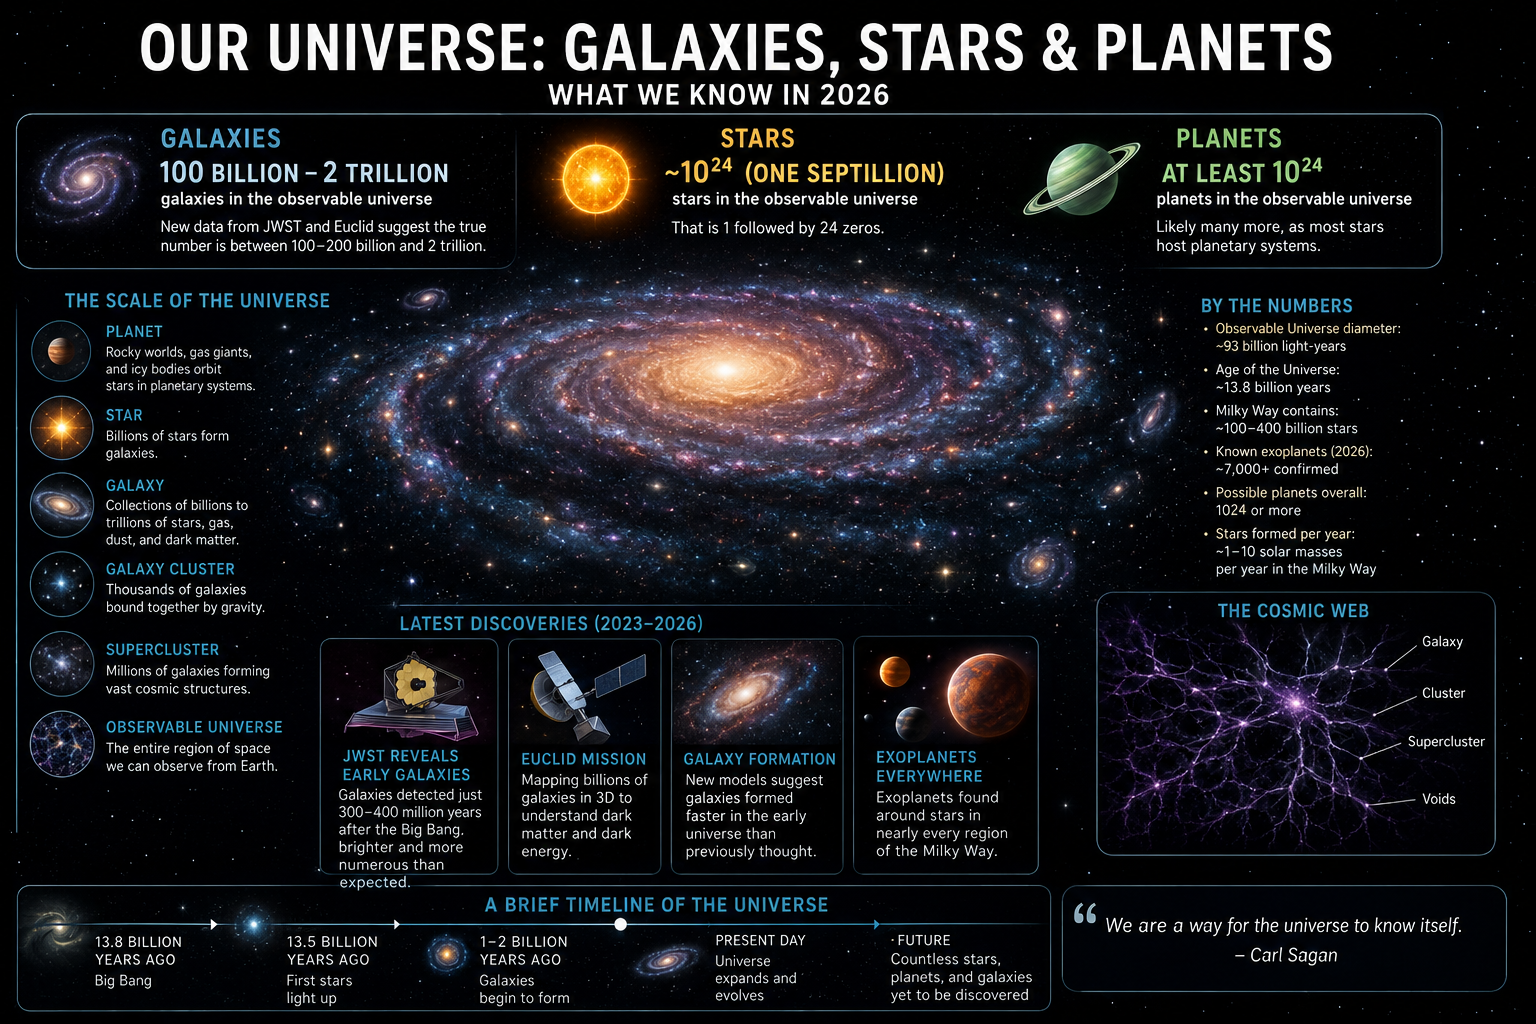
Counting the Galaxies, Stars, and Planets of the Observable Universe
EXECUTIVE SUMMARY
Ask an astronomer how many galaxies, stars, and planets exist in the universe, and the honest answer in 2026 is the same as it was a decade ago: we do not know precisely, and the leading estimates have themselves been revised, several times, in opposite directions. This article surveys the current state of that count — not as a single settled number, but as a moving target shaped by new instruments, revised statistical methods, and a genuine scientific disagreement that has played out publicly over the past two years.
Three headline figures anchor the discussion. First, the number of galaxies in the observable universe has swung from an early Hubble-era estimate of roughly 100–200 billion, to a widely publicized 2016 recalculation of approximately two trillion, to a 2021–2025 re-analysis using NASA’s New Horizons spacecraft that pulled the number back down toward a few hundred billion. Second, the number of stars in the observable universe is generally quoted somewhere between ten sextillion and one septillion (10 to the 22nd, 23rd, or 24th power), though this figure is derived entirely from statistical extrapolation rather than direct counting, and a 2010 finding about the abundance of faint red dwarf stars still ripples through every subsequent estimate. Third, and by contrast the most concrete of the three, the tally of confirmed exoplanets — planets orbiting stars beyond our own Sun — is not an extrapolation at all but a running, auditable count: it passed 6,000 in 2025 and stood at 6,316 confirmed worlds as of early July 2026, according to the NASA Exoplanet Archive.
The throughline of this research is not that scientists are guessing wildly, but that every method of counting cosmic objects trades off against a different source of bias, and the last several years have been defined by attempts to reconcile those biases against each other. The James Webb Space Telescope, in particular, has forced a rethink of early-universe galaxy formation, revealing both surprisingly bright, massive galaxies that appear to defy standard timelines and, more recently, evidence that some of that brightness comes from actively feeding supermassive black holes rather than star populations at all — a distinction that materially changes the galaxy count at the earliest cosmic epochs.
This article is organized in seven parts. It begins with why cosmic counting is intrinsically difficult, then works through galaxies, the James Webb era specifically, stars, and planets in turn, before closing with a discussion of methodological tensions and the broader implications of these figures — including the darkness of the night sky, the search for habitable worlds, and the missions on the near horizon (Roman Space Telescope, Gaia’s next data release, and an expanding TESS catalogue) that are likely to move these numbers again before the decade is out.
[AT A GLANCE]
Galaxies: roughly a few hundred billion to two trillion in the observable universe (estimates under active revision). Stars: on the order of 10²²–10²⁴ in the observable universe. Confirmed exoplanets: 6,316 as of 2 July 2026, across 4,725 planetary systems.
Readers approaching this subject for the first time should not treat the range of figures that follows as a failure of astronomy to answer a simple question. It reflects, instead, a field that is unusually transparent about the difference between what has been directly measured and what has been inferred from a model — a distinction this article returns to repeatedly, because it is the single most useful lens for evaluating any cosmic statistic encountered outside these pages, whether in a textbook, a museum exhibit, or a news headline.
PART I — THE SCALE PROBLEM: WHY COSMIC COUNTING IS SO HARD
Before examining any specific number, it is worth understanding why counting galaxies, stars, or planets is fundamentally unlike counting almost anything else. On Earth, a census is difficult but bounded: the thing being counted stays still long enough, and is, in principle, visitable. In cosmology, none of that is true. Every object under discussion is observed only through the light it emitted at some point in the past — in many cases, a past that predates the formation of the Earth itself — and the observer is fixed at a single vantage point with no ability to move around the object being studied.
1.1 The observable universe is not the whole universe
The observable universe is the sphere of space from which light has had time to reach Earth since the Big Bang, roughly 13.8 billion years ago. Because space itself has been expanding throughout that time, the radius of this sphere is not 13.8 billion light-years but closer to 46.5 billion light-years, giving the observable universe a diameter of about 92 billion light-years and a volume that is difficult to describe in intuitive terms — commonly cited as on the order of 400 nonillion cubic light-years. Every galaxy count discussed in this article refers only to this observable region. The universe beyond it may be far larger, and recent theoretical work has not ruled out the possibility that the total universe is infinite, in which case questions about the ‘true’ number of galaxies or stars become meaningless in the way that asking for the largest whole number is meaningless. All specific figures that follow are therefore bounded estimates of the observable universe, not the universe as a whole.
1.2 The pinhead method
No survey has ever counted every galaxy visible to a telescope across the entire sky; the task would take longer than the length of most scientific careers even with automated detection. Instead, astronomers rely on what is sometimes informally called the pinhead method: they point an instrument at a very small, carefully chosen patch of sky — historically an area comparable to holding a grain of sand at arm’s length — image it as deeply as possible, count every detectable galaxy in that patch, and then multiply by the number of equivalent patches needed to tile the full sky. This is precisely how the Hubble Deep Field (1995), the Hubble Ultra Deep Field, and their successors produced the numbers that dominated public understanding of the universe for two decades.
The method is statistically sound in principle, but it is only as good as two assumptions: that the sampled patch is representative of the sky as a whole, and that the telescope used can detect every galaxy present in that patch, including the faintest and most distant ones. Both assumptions have been challenged and revised multiple times in the last ten years, and each revision has moved the final estimate substantially.
1.3 Two structurally different sources of undercount
There are, broadly, two reasons a galaxy census can miss objects, and distinguishing between them is central to understanding why the 2016 and 2021 estimates disagree so sharply. The first is instrumental sensitivity: a galaxy may simply be too faint, too small, too red-shifted into infrared wavelengths, or too obscured by intervening dust and gas for a given telescope to detect it directly. The second is inference from indirect evidence: astronomers can estimate how many additional, undetected galaxies must exist by measuring the total diffuse background glow of the night sky and asking how much of it is unaccounted for by the galaxies already catalogued. The 2016 estimate of roughly two trillion galaxies, led by Christopher Conselice at the University of Nottingham, relied heavily on the second approach — mathematical modeling of galaxy mass functions across cosmic time — while the 2021 New Horizons-based study, led by Tod Lauer of NSF’s NOIRLab and Marc Postman of the Space Telescope Science Institute, relied on the first: a direct measurement of the sky’s background darkness from a vantage point far outside the zodiacal dust of our own solar system, which had previously contaminated similar measurements taken from Earth or near-Earth orbit.
[WHY NEW HORIZONS MATTERS]
New Horizons, NASA’s Pluto probe, is now more than 50 times farther from the Sun than Earth is — far enough to escape the faint glow of interplanetary dust (zodiacal light) that has always complicated Earth-based measurements of the sky’s true darkness. Its cameras gave astronomers the cleanest measurement yet of the universe’s total background light, and that measurement came back dimmer than the two-trillion-galaxy model predicted.
1.4 Stars and planets inherit the same problem, twice over
Star counts compound the galaxy-counting problem because no galaxy’s stars, including our own Milky Way’s, have ever been individually counted in full. Earth sits inside the Milky Way’s disk, roughly 26,000 light-years from the galactic centre, which means star counting here is closer to counting trees while standing inside a forest than counting them from above. Estimates instead proceed from the galaxy’s total mass — inferred from its rotation curve and gravitational effects — divided by an assumed average stellar mass, a method sensitive to exactly the kind of assumption that a 2010 study by Pieter van Dokkum at Yale upended, when spectroscopic evidence suggested that faint red dwarf stars might be three times more common in elliptical galaxies than models built from the Milky Way alone had assumed. Planet counts, in turn, depend on star counts and on how often stars host planets at all — a figure called the occurrence rate, which is still being refined star-type by star-type. Each layer of this chain — galaxies, then stars, then planets — carries forward the uncertainty of the layer beneath it, which is why the planet estimate necessarily has the widest error bars of the three, even though the number of confirmed individual exoplanets is, ironically, the most concrete figure in this entire article.
With that framing in place, the remainder of this article works through each of the three counts in turn, tracing how the estimates have moved and why, before turning to the missions expected to refine them further before the end of the decade.
1.5 A short history of getting the scale wrong, productively
It is worth pausing on how recent this entire line of inquiry actually is, because the pace of revision only makes sense in that context. Serious quantitative estimates of the number of galaxies beyond the Milky Way are barely a century old: it was only in 1923 that Edwin Hubble, using the 100-inch Hooker Telescope at Mount Wilson, established that the Andromeda ‘nebula’ was in fact a separate galaxy entirely, resolving a debate about whether the Milky Way constituted the whole of the universe. From that starting point, each subsequent instrumental leap — the Palomar 200-inch telescope in the 1940s, the Hubble Space Telescope in 1990, and now the James Webb Space Telescope from 2021 onward — has not simply added detail to a stable picture but has repeatedly forced a wholesale revision of the headline numbers, often by an order of magnitude or more in a single step. Framed this way, the disagreements described later in this article are not an aberration from an otherwise settled science; they are the latest instance of a pattern that has held for a hundred years and shows no sign of stopping.
1.6 Four independent counting problems, one article
It is useful to keep in mind that ‘the number of galaxies’, ‘the number of stars’, and ‘the number of planets’ are not three versions of the same question asked at different scales — they are four genuinely distinct measurement problems, each with its own instruments, its own dominant sources of error, and, in several cases, its own community of specialists who do not necessarily agree with one another. Galaxy counting is primarily a problem of deep-field imaging and background-light photometry. Star counting is primarily a problem of stellar mass functions and galactic dynamics. Planet counting is primarily a problem of high-precision photometry and spectroscopy of individual, nearby stars. And a fourth, related problem — estimating how many of those planets might be habitable — is primarily a problem of atmospheric and orbital modelling layered on top of the other three. Keeping these four problems analytically separate, rather than treating them as a single undifferentiated ‘how big is the universe’ question, is what allows the more detailed comparisons in later parts to make sense.
| Year | Instrument / Milestone | Effect on cosmic counting |
|---|---|---|
| 1923 | Hooker Telescope (Edwin Hubble) | Established Andromeda as a separate galaxy; founded modern galaxy counting |
| 1940s | Palomar 200-inch telescope | Extended deep-sky surveys and galaxy cataloguing |
| 1990 | Hubble Space Telescope launched | Enabled Deep Field / Ultra-Deep Field surveys underlying decades of galaxy estimates |
| 1995 | First exoplanet around a Sun-like star | Founded the modern exoplanet census |
| 2006 | New Horizons launched | Later enabled a dust-free background-light measurement of the sky |
| 2013 | Gaia spacecraft launched (ESA) | Produced the most detailed 3D map of Milky Way stars to date |
| 2016 | Conselice et al. galaxy re-analysis | Raised galaxy estimate to ≈ 2 trillion |
| 2018 | TESS launched | Accelerated exoplanet discovery via all-sky transit survey |
| 2021 | James Webb Space Telescope launched | Opened direct infrared observation of the earliest galaxies |
| 2021–2025 | New Horizons background-light analysis | Revised galaxy estimate down toward hundreds of billions |
| 2026 | Nancy Grace Roman Space Telescope (launch 30 Aug) | Projected to add 100,000+ exoplanets and refine galaxy surveys |
PART II — GALAXIES: FROM 200 BILLION TO 2 TRILLION, AND BACK AGAIN
2.1 The pre-2016 consensus
For roughly two decades after the Hubble Ultra Deep Field was released, the figure most commonly cited for the number of galaxies in the observable universe was somewhere between 100 and 200 billion. This estimate came directly from counting galaxies visible in the deepest Hubble images and extrapolating that density across the full sky, without attempting to model galaxies too faint for Hubble to detect at all. It was, in other words, a lower bound dressed as a headline figure, and it was treated as settled science in classrooms and popular science writing well into the 2010s.
2.2 The 2016 revision: ten times more
In 2016, Christopher Conselice and colleagues at the University of Nottingham published a reanalysis that converted deep Hubble images into three-dimensional galaxy distributions across different epochs of cosmic history, then applied new mathematical models to infer the population of galaxies too small and faint for Hubble to resolve directly. Their conclusion, published in The Astrophysical Journal, was striking: to make the observed masses and current galaxy counts add up consistently with galaxy formation theory, roughly ninety percent of the galaxies that must have existed earlier in the universe’s history were too faint to be seen with the telescopes available at the time. This pushed the total estimate for the observable universe to approximately two trillion galaxies — about ten times higher than the older figure — and offered, as a bonus, a tidy resolution to a centuries-old puzzle known as Olbers’ paradox (why the night sky is dark despite an enormous, possibly infinite, number of stars): with that many galaxies packed into cosmic history, the team argued that every patch of sky technically does contain part of a galaxy, but the light from the most distant and numerous ones has been so redshifted and diluted by cosmic expansion that it never becomes visible to the naked eye.
The two-trillion figure quickly became the new default in textbooks, museum placards, and science journalism, and it is still the number most non-specialists would give if asked today.
2.3 The New Horizons recalibration
The two-trillion estimate, however, was a model-based inference, not a direct observation — it depended on assumptions about how numerous and faint the undetected population of galaxies must be. Beginning around 2021 and continuing through subsequent analysis published through 2025, a team led by Tod Lauer (NSF’s NOIRLab) and Marc Postman (Space Telescope Science Institute) used the New Horizons spacecraft — by then well beyond Pluto’s orbit and far outside the zodiacal dust cloud that clutters every measurement taken from near Earth — to directly measure the total background glow of the sky in visible light. If two trillion galaxies truly existed, a specific, calculable amount of unaccounted-for background light should have shown up in that measurement. It did not. As Postman put it in the resulting NASA-affiliated release, the team simply did not see the light of two trillion galaxies; taking every galaxy Hubble can detect and doubling that number accounted for essentially all of the background glow actually measured, with little room left for a further ninety percent of unseen galaxies. The revised estimate this implies is a much more modest few hundred billion galaxies in the observable universe — closer, ironically, to the original pre-2016 figure than to the two-trillion estimate that superseded it.
[TWO CREDIBLE ESTIMATES, IN TENSION]
As of 2026, two peer-reviewed lines of evidence disagree by roughly an order of magnitude: model-based inference (≈ 2 trillion galaxies, Conselice et al., 2016) versus direct background-light measurement (≈ a few hundred billion, Lauer, Postman et al., analysis through 2025). Both remain in the literature. Neither has been definitively falsified.
2.4 What could resolve the disagreement
The Lauer and Postman team explicitly framed their finding as a question for the James Webb Space Telescope to help answer: if the missing ninety percent of galaxies from the Conselice model genuinely exist as faint, individual, star-forming systems, then an instrument as sensitive as Webb, observing in infrared wavelengths particularly suited to detecting redshifted early-universe light, ought to be able to detect at least a meaningful fraction of them directly, rather than inferring their existence indirectly. Whether Webb’s early-universe surveys have settled that question, complicated it further, or done a bit of both is the subject of Part III of this article.
2.5 Our own cosmic neighbourhood: the Local Group in 2026
While the observable-universe-wide estimates remain contested, closer to home the picture has become considerably clearer and has moved firmly in one direction: upward. Twenty years ago, the standard estimate for the number of galaxies in the Local Group — the cluster of galaxies gravitationally bound to the Milky Way and Andromeda — was around fifty to sixty, of which only Andromeda was thought to rival the Milky Way in size. As of 2026, deeper surveys and improved detection of faint dwarf satellite galaxies have pushed that figure past two hundred, though the overwhelming majority of the newly identified members are small, low-mass dwarf galaxies rather than large spiral or elliptical systems comparable to the Milky Way or Andromeda themselves.
| Estimate / Era | Method | Galaxy Count (Observable Universe) |
|---|---|---|
| Pre-2016 (Hubble Deep/Ultra-Deep Field) | Direct count, no faint-galaxy correction | ≈ 100–200 billion |
| 2016 (Conselice et al.) | 3D modeling + mass-function inference | ≈ 2 trillion |
| 2021–2025 (Lauer, Postman et al.) | New Horizons background-light measurement | ≈ hundreds of billions |
| Local Group (2026) | Direct dwarf-galaxy survey | 200+ (up from ~50–60 two decades ago) |
2.6 What counts as a galaxy in the first place?
A subtler complication behind every figure in this section is that ‘galaxy’ is not as precisely bounded a term as it might seem. Researchers constructing these estimates typically need to set a minimum mass threshold below which an object is no longer counted as a galaxy at all, rather than as a star cluster or a fragment of a larger, disrupted system. A conservative convention sets that floor at around one million solar masses; using this threshold, published estimates for the observable universe cluster in the range of one to two trillion galaxies, broadly consistent with the Conselice figure. Loosen or tighten that threshold, however, and the total count shifts accordingly, since the galaxy population is heavily skewed toward small, low-mass systems — the same dwarf galaxies that dominate the Local Group’s 2026 count discussed above. This is not a flaw in the research so much as a reminder that ‘how many galaxies exist’ is partly a definitional question dressed up as an observational one.
2.7 Merger history and the changing galaxy population
The Conselice team’s 2016 analysis carried an additional finding that is easy to overlook amid the headline two-trillion figure: galaxies are not distributed evenly across cosmic history. Their three-dimensional reconstruction found that a given volume of space contained roughly ten times as many galaxies in the early universe as it does today, with most of those early galaxies being small and comparable in mass to the dwarf satellite galaxies now seen orbiting the Milky Way. Over billions of years, gravitational mergers progressively combined these smaller systems into the larger galaxies observed nearby today, steadily reducing the total galaxy count even as the total stellar mass contained within surviving galaxies increased. This top-down model of structure formation — many small galaxies merging over time into fewer, larger ones — is one of the pieces of evidence the Conselice team cited in support of the higher, model-inferred galaxy count, since it requires a very large initial population of small early galaxies to explain the mass of galaxies observed today.
2.8 A note on galaxy clusters
Individual galaxies are themselves organized into larger bound structures called galaxy clusters — some of the largest gravitationally bound objects known, containing anywhere from a few hundred to several thousand individual galaxies embedded in a shared halo of hot gas and dark matter. The existence of these clusters adds yet another layer of complexity to any galaxy count, since a survey’s chosen patch of sky might, by chance, sample a particularly dense cluster region or an unusually sparse void region, skewing the resulting extrapolation in either direction unless the survey design specifically corrects for this large-scale clustering. Modern deep-field surveys, including those behind the Conselice and Lauer-Postman estimates discussed above, explicitly account for this clustering bias using large-scale structure maps built from galaxy redshift surveys, but it remains one of the harder sources of systematic error to fully eliminate.
2.9 Extremes at the edge of the distribution
Statistical totals can obscure just how wide the range of individual galaxy sizes really is, and it is worth grounding the abstract trillions discussed above in a handful of concrete extremes. Among the largest galaxies identified to date is ESO 383-76, a supergiant elliptical galaxy roughly 1,764,000 light-years in diameter — more than seventeen times the diameter of the Milky Way — located around 654 million light-years away in the constellation Centaurus. Other candidates for the largest known galaxy, including IC 1101 and the more recently identified Alcyoneus, remain subjects of ongoing debate, precisely because ‘size’ can be measured by visible light extent, total stellar mass, or the full extent of faint outer structures, each of which can produce a different ranking. Among spiral galaxies specifically, UGC 2885 is the largest known, while NGC 6872, nicknamed the Condor Galaxy, is the largest known barred spiral, spanning roughly 522,000 light-years — more than five times the Milky Way’s diameter. At the opposite end of the distribution, the dwarf galaxies that make up the bulk of the Local Group’s 2026 count of 200-plus members can contain as few as a few tens of thousands of stars, a difference of many orders of magnitude from the largest ellipticals within the same broad category of ‘galaxy.’ This range is a useful concrete illustration of why the minimum-mass threshold discussed above has such a large effect on the final galaxy count.
PART III — THE JAMES WEBB ERA: REWRITING THE EARLY UNIVERSE
3.1 A telescope built for exactly this problem
The James Webb Space Telescope (JWST), launched on Christmas Day 2021, was designed from the outset to see further back in cosmic time than Hubble ever could, using a mirror roughly six times the collecting area of Hubble’s and instruments tuned to the infrared wavelengths into which the most distant light is redshifted. Almost immediately after beginning science operations in mid-2022, Webb began returning images of the early universe that did not match expectations — not because there were too few galaxies, as the Lauer-Postman work might have predicted, but because the galaxies present appeared unexpectedly large, bright, and numerous for how soon after the Big Bang they had formed.
3.2 The ‘impossible early galaxies’ controversy
Standard cosmological models did not predict enough time, within the first few hundred million years after the Big Bang, for galaxies to accumulate the stellar mass that some of Webb’s earliest images seemed to show. This triggered a genuine period of uncertainty in the field between 2022 and 2024, with some researchers suggesting that the standard model of cosmology itself might need revision. A 2024 study led by Katherine Chworowsky at the University of Texas at Austin, published in The Astronomical Journal, offered a more conservative resolution for a significant fraction of these cases: several of the galaxies that appeared implausibly massive turned out to host actively feeding supermassive black holes at their centres, whose friction-heated infalling gas produces intense light that inflates a galaxy’s apparent brightness and, by extension, its apparent stellar mass, without a corresponding number of actual stars. Once that contribution is subtracted, many — though not all — of the earlier ‘impossible’ galaxies became consistent with standard formation timelines.
Not every anomaly has been resolved this way. In early 2025, researchers including Themiya Nanayakkara of Swinburne University of Technology identified a large, spiral-structured galaxy — informally nicknamed the ‘Big Wheel’ — existing within the first two billion years of the universe. Spiral structure is normally associated with a long, undisturbed history free of major galactic mergers, yet a galaxy this early in cosmic history would ordinarily be expected to have experienced multiple violent mergers, which tend to destroy spiral arms and produce smoother, elliptical shapes instead. The Big Wheel’s well-preserved spiral structure suggests either an unusually gentle growth history or that a large share of its mass formed in place rather than through merging, and researchers have been explicit that this single object, however striking, is not yet known to be representative of early massive galaxies generally.
[RESEARCHER’S NOTE]
Priyamvada Natarajan, a theoretical astrophysicist at Yale, summarized the state of the field in late 2025 by observing that no single Webb data set has ‘broken’ the standard cosmological model outright, but that interesting tensions are emerging at different scales that will require revisiting foundational assumptions about galaxy growth.
3.3 Little red dots and ‘black hole stars’
A further wrinkle emerged through 2025: Webb surveys identified a population of small, extremely compact, unusually red objects in the early universe — nicknamed ‘little red dots’ — whose nature is still debated. Some researchers proposed in mid-2025 that a subset of these objects may not be conventional galaxies at all, but a previously unrecognized category sometimes described as ‘black hole stars’: compact systems dominated by an actively accreting black hole enshrouded in dense gas, rather than by a normal stellar population. A separate August 2025 study from the University of Missouri catalogued roughly three hundred galaxy-like objects from Webb’s NIRCam data whose properties defy straightforward explanation under current models, underscoring that the census of the earliest galaxies is still very much a work in progress rather than a closed question.
3.4 Small galaxies doing outsized work
Not all of Webb’s early-universe findings have been destabilizing. A 2025 analysis using the UNCOVER survey, led by Isak Wold of the Catholic University of America and NASA’s Goddard Space Flight Center, identified 83 small, low-mass, intensely star-forming ‘starburst’ galaxies as they existed when the universe was only about 800 million years old — roughly six percent of its current age. These galaxies, though individually modest in mass, were found to produce ultraviolet light with disproportionate efficiency, and the research team concluded that a population of this kind, if representative, could plausibly account for the total amount of ultraviolet light required to have ionized the universe’s neutral hydrogen during the era known as cosmic reionization — a long-standing open problem in cosmology. This finding is a useful counterweight to the ‘impossible early galaxy’ headlines: much of Webb’s most scientifically important work on the early universe has involved abundant small galaxies quietly doing the work of transforming the cosmos, rather than singular, anomalously massive ones.
3.5 Where this leaves the galaxy count
Taken together, the Webb-era findings have not yet delivered a clean verdict on the Conselice-versus-Lauer/Postman disagreement described in Part II. If a meaningful share of the ‘missing’ faint galaxies implied by the 2016 model are real and are gradually being confirmed by Webb’s deep surveys, that would tend to support the higher, roughly two-trillion figure. If, instead, a substantial fraction of Webb’s apparently abundant early-universe light turns out to originate from black hole activity rather than star populations — as the Chworowsky and ‘black hole star’ findings both suggest, in different ways — that would tend to support the lower, few-hundred-billion figure, since it implies fewer genuine galaxies are needed to produce the light already observed. Both interpretive threads are active in the literature as of 2026, and a settled reconciliation has not yet been published.
3.6 Record-breaking distances and what they reveal
Beyond the population-level debates, Webb has repeatedly broken individual distance records for the earliest known galaxies, and each record has offered its own supporting evidence about the early universe’s structure. The galaxy JADES-GS-z13-1, observed as part of the JWST Advanced Deep Extragalactic Survey (JADES), was found to exist just 330 million years after the Big Bang, at a redshift of 13.05, and in follow-up analysis was confirmed to emit a specific hydrogen signature known as Lyman-alpha radiation. This detection was itself a minor puzzle: at that early epoch, the universe should still have been filled with a thick fog of neutral hydrogen gas capable of absorbing exactly this kind of light before it could escape the galaxy, meaning the galaxy’s surrounding region must already have been substantially ionized earlier than standard reionization timelines would predict. More recently, a galaxy catalogued as MoM-z14 has been identified at an even higher redshift of 14.44, currently the most distant astronomical object known. Each of these individual discoveries functions as a data point constraining how quickly the early universe could plausibly have formed and ionized enough galaxies to match what Webb is now seeing directly — feeding back, again, into the broader galaxy-count debate from Part II.
3.7 The scientific temperament this field requires
Perhaps the most striking feature of the Webb-era literature, for a non-specialist reader, is how comfortable the researchers themselves are with sitting inside an unresolved puzzle. Katherine Chworowsky, whose 2024 work resolved a meaningful share of the ‘impossible early galaxy’ cases through black hole light contamination, was explicit that not every anomaly was accounted for by her model, and described the remaining uncertainty as part of what makes the field ‘fun’ rather than a problem to be embarrassed about. This is a useful corrective to the way popular coverage sometimes frames each new Webb finding as either confirming or ‘breaking’ the standard model of cosmology in a single decisive stroke; the actual research process looks more like a slow, methodical narrowing of plausible explanations across many independent lines of evidence, of which this article has covered only a representative sample.
PART IV — STARS: COUNTING LIGHT IN THE DARK
4.1 What the human eye can and cannot do
On a clear, dark night, away from artificial light, the unaided human eye can resolve roughly six to nine thousand individual stars across the entire visible sky — a number small enough to count by hand in about fifteen minutes, and a useful reminder of just how small a fraction of the universe’s stellar population is directly visible without instruments. Every star count discussed in the rest of this section is therefore a statistical inference, built up in stages from the Milky Way outward, rather than a direct tally.
4.2 Counting from the inside: the Milky Way
Earth’s position inside the Milky Way’s disk, roughly 26,000 light-years from the galactic centre, means the galaxy’s own stars cannot be surveyed the way an external observer might survey another galaxy from outside. Historically, astronomers approached this by measuring the galaxy’s total mass — inferred from the orbital speeds of stars and gas at different distances from the centre, a method that also revealed the presence of dark matter — and dividing by an assumed average stellar mass. This approach yields the commonly cited figures of 100 to 400 billion stars in the Milky Way, with recent overviews from NASA and other agencies favouring a figure toward the lower-middle of that range for the total stellar population, while noting that low-mass stars far outnumber high-mass ones.
The European Space Agency’s Gaia mission, launched in December 2013 and still operating as of 2026, has taken a more direct approach for a subset of stars: precisely measuring the positions, distances, motions, colours, and brightness variations of individual stars through repeated observation. By April 2026, Gaia had measured close to two billion individual stars — an extraordinary achievement, and by a wide margin the most detailed three-dimensional map of the Milky Way ever produced — yet this still represents only about one percent of the galaxy’s total estimated stellar population, since the remainder are too faint, too distant, or too obscured by interstellar dust for even Gaia’s sensitive instruments to catalogue individually.
4.3 The van Dokkum correction and its long shadow
A significant complication to mass-based star counting emerged from a 2010 study led by Pieter van Dokkum at Yale University, which used spectroscopic analysis of elliptical galaxies to argue that red dwarf stars — small, dim, low-mass stars that are difficult to detect individually even in relatively nearby galaxies — might be roughly three times more common in other galaxies than models built primarily on the Milky Way’s own stellar population had assumed. If that finding holds broadly across galaxy types, it implies that commonly cited star-count figures derived from Milky-Way-based ratios could understate the true total by a factor of three or more. This is one of the more consequential and under-appreciated revisions in the field, precisely because it does not produce a single dramatic headline number the way the galaxy-count debate has, but instead quietly widens the uncertainty band on every subsequent total-star estimate that builds on galaxy-mass assumptions.
4.4 From one galaxy to the whole observable universe
Extrapolating from the Milky Way to the observable universe as a whole requires multiplying an assumed average stellar population per galaxy by the total number of galaxies — which immediately imports the entire galaxy-count uncertainty discussed in Parts II and III. Because of this compounding uncertainty, published totals for the number of stars in the observable universe vary by roughly two orders of magnitude depending on which galaxy-count estimate and which average-stars-per-galaxy assumption are used. Commonly cited figures include approximately ten sextillion stars (a 1 followed by 22 zeros), roughly one hundred sextillion to two hundred sextillion stars (10 to the 23rd power range, sometimes framed evocatively as more numerous than every grain of sand on every beach on Earth), and an upper estimate of about one septillion stars (a 1 followed by 24 zeros) cited by NASA’s own public science communications as of 2026. Separately, under certain cosmic inflation models that posit a universe far larger than the observable portion, purely theoretical (and empirically untestable) estimates run as high as 10 to the 100th power stars across the universe as a whole — a figure that should be understood as a mathematical consequence of inflationary theory rather than an observational claim about anything measurable.
[A CAUTION ON ‘OVERESTIMATION’]
A widely circulated shortcut — simply multiplying the Milky Way’s roughly 400 billion stars by the number of galaxies in the universe — is now understood by researchers to overestimate the true total by a factor of many hundreds, because the Milky Way is not a representative galaxy. Most galaxies in the universe are far smaller, fainter dwarf galaxies with dramatically fewer stars, and even organizations as established as the European Space Agency have, at times, published estimates that did not fully correct for this skew.
| Estimate | Basis | Order of Magnitude |
|---|---|---|
| Milky Way stellar population | Mass-based / Gaia-supplemented | 10¹¹–4×10¹¹ (100–400 billion) |
| Observable universe (conservative) | Galaxy count × average stars/galaxy | ≈ 10²² (10 sextillion) |
| Observable universe (NASA public estimate) | Galaxy count × average stars/galaxy | up to ≈ 10²⁴ (1 septillion) |
| Theoretical, under cosmic inflation | Model-dependent, untestable | up to ≈ 10¹⁰⁰ |
4.5 Star formation history: knowing the rate to know the total
A separate line of evidence for total star counts comes not from counting galaxies or measuring mass, but from tracking the rate at which stars have formed throughout cosmic history and integrating that rate over time. The European Space Agency’s Herschel infrared observatory made a significant contribution here by measuring galaxy luminosity in infrared wavelengths — a proxy for ongoing star formation, since young, hot stars and the dust clouds they warm both radiate strongly in this range — and charting how that formation rate has changed since the early universe. Early work using visible-light Hubble imagery suggested star formation peaked roughly seven billion years ago, but subsequent infrared observations revealed that a substantial fraction of early star formation had been hidden from optical telescopes entirely, obscured by thick dust clouds that only infrared instruments can see through. This finding, echoed independently in a 2018 gamma-ray-based reconstruction of the universe’s star formation history published in the journal Science, reinforces a theme found throughout this article: methods relying on visible light alone have repeatedly been shown to undercount activity in the early, dust-obscured universe, whether the object being counted is a galaxy, a star-forming region, or an individual star population.
4.6 A cautionary survey result
A 2008 result from the Sloan Digital Sky Survey (SDSS), which catalogued observable objects across roughly a third of the sky, is a useful illustration of how even a large, well-instrumented survey can undercount a stellar population relative to theoretical expectation. That survey detected approximately 48 million stars within its coverage area — roughly half the number astronomers had expected to find based on independent galactic models current at the time. Part of the shortfall was attributable to the survey’s specific brightness sensitivity: a star as intrinsically bright as our own Sun would not necessarily register in such a catalogue if it lay far enough away, meaning even a large, systematic survey of this kind still functions as a lower bound rather than a complete inventory, echoing the same ‘pinhead method’ limitation discussed for galaxy surveys earlier. This result is a useful reminder that the gap between a survey’s raw detections and a field’s headline estimate is not confined to exotic, cutting-edge instruments like Webb or New Horizons; it shows up even in comparatively routine, well-established sky surveys.
4.7 Why star counts matter beyond curiosity
The total stellar population of the observable universe is not merely a trivia figure; it is a direct input into several other major open questions in astrophysics. The total number and mass of stars sets an upper bound on how many planetary systems could plausibly exist, feeding directly into the planet estimates discussed in Part V. It also constrains models of the universe’s total ordinary (baryonic) matter budget, since stars represent one of the few directly observable repositories of that matter, as distinct from the far larger, gravitationally inferred but never directly observed reservoir of dark matter. And the rate at which stars have formed and died throughout cosmic history directly determines the chemical enrichment of the universe over time, since heavier elements beyond hydrogen and helium are produced almost exclusively inside stars and distributed into surrounding space when those stars die, whether gently or in supernova explosions. In this sense, the star-counting exercise described throughout this section is not an isolated curiosity but one of the load-bearing measurements underneath much of modern astrophysics.
It is also worth noting, in closing this section, that the life cycle of individual stars ties directly back to the counting problem itself: a low-mass red dwarf may shine, largely unchanged, for trillions of years — far longer than the current age of the universe — while the most massive stars burn through their fuel and end in a supernova within a few million years. This means any snapshot star count is inevitably a mixture of stars at wildly different points in extremely different lifespans, and that the true stellar population is neither static nor uniform, but a continuously shifting balance between newly formed stars and the remnants — white dwarfs, neutron stars, and black holes — left behind by those that have already died.
PART V — PLANETS: THE EXOPLANET CENSUS PASSES 6,300
5.1 The one number in this article that is not an estimate
Unlike galaxy and star counts, which are statistical extrapolations from limited sampling, the confirmed exoplanet count is a running, individually verified tally maintained by the NASA Exoplanet Archive, operated by Caltech’s Infrared Processing and Analysis Center on behalf of NASA’s Exoplanet Exploration Program. As of 2 July 2026, the archive listed 6,316 confirmed exoplanets across 4,725 distinct planetary systems, of which 1,055 systems are known to host more than one planet. The archive crossed the 6,000-planet milestone in 2025, with the milestone-marking batch consisting largely of rocky worlds between the size of Earth and Neptune — currently the most common category of confirmed exoplanet. Because confirmation requires independent corroborating evidence rather than a single detection, each entry in this figure represents a planet whose existence is considered scientifically settled, not merely inferred — a meaningfully different epistemic status from the galaxy and star totals discussed earlier in this article.
5.2 How exoplanets are found
The great majority of confirmed exoplanets have been detected using one of two indirect methods. Transit photometry looks for a small, periodic dimming in a star’s brightness as an orbiting planet passes directly in front of it from Earth’s vantage point; this is the method behind most discoveries from NASA’s Kepler mission and its successor, the Transiting Exoplanet Survey Satellite (TESS), which alone accounted for nearly half of all exoplanets confirmed since 2022. Radial velocity, or Doppler spectroscopy, instead looks for the small back-and-forth wobble a planet’s gravity induces in its host star, detected as a shifting pattern in the star’s light spectrum. A smaller number of planets have been found through gravitational microlensing, where a foreground star’s gravity briefly magnifies the light of a background star in a way a planet’s added gravity subtly distorts, and fewer than one hundred exoplanets to date have been directly imaged, since most planets are far too faint relative to their host star’s glare to be photographed conventionally. Because transit and radial-velocity methods are both far more sensitive to large planets orbiting close to their star, the confirmed catalogue carries a significant observational bias toward exactly that kind of planet, and the true underlying population is understood to include many more small, distant, or otherwise hard-to-detect worlds than the confirmed tally alone would suggest.
5.3 From thousands confirmed to billions inferred
Astronomers widely believe that planets vastly outnumber the roughly six thousand confirmed so far, and that essentially every star in the galaxy hosts at least one planet on average. One frequently cited extrapolation holds that about one in five Sun-like (G-type) stars has an Earth-sized planet within its habitable zone — the orbital distance range where conditions might allow liquid water on a planet’s surface. Applying that ratio to an assumed 200 billion total stars in the Milky Way, and roughly 50 billion of those being Sun-like, implies on the order of 11 billion potentially habitable Earth-sized planets within our own galaxy alone; broadening the ratio to include the far more numerous red dwarf stars, which host planets at comparable or higher rates, raises that estimate to roughly 40 billion. It bears repeating that this is a single galaxy’s estimate, not the observable universe’s, and that it still inherits the same layered uncertainty — about total star counts, about planet occurrence rates by star type, and about what counts as ‘habitable’ in the first place — discussed throughout this article.
[FROM CONFIRMED TO CANDIDATE]
Beyond the 6,316 confirmed exoplanets, more than 8,000 additional candidate planets are currently awaiting confirmation in NASA’s pipeline. Jessie Christiansen, chief scientist of the NASA Exoplanets Institute, has publicly predicted the confirmed tally will reach 10,000 within a few years, driven substantially by incoming data from ESA’s Gaia mission and NASA’s upcoming Roman Space Telescope.
5.4 The next wave of discovery
Several missions positioned to materially expand the exoplanet catalogue over the remainder of this decade are already underway or imminent. NASA’s Nancy Grace Roman Space Telescope received an accelerated launch date of 30 August 2026, eight months ahead of its prior schedule, and is expected to survey more than fifty times as much sky in its first five years as Hubble managed across three decades; NASA’s own projections anticipate Roman alone could discover more than 100,000 additional exoplanets, along with hundreds of planetary systems caught in the act of forming. Separately, ESA’s Gaia mission — already responsible for mapping the positions and motions of nearly two billion Milky Way stars — is expected to release a substantial new batch of exoplanet detections in 2026, this time using an astrometric technique that detects a planet’s gravitational tug on its star’s position in the sky, a method distinct from and complementary to transit and radial-velocity detection. Meanwhile, TESS continues its own all-sky survey, and by mid-2025 had identified more than 7,500 candidate exoplanets, of which over 600 had achieved confirmed status.
| Metric | Figure | As of |
|---|---|---|
| Confirmed exoplanets | 6,316 | 2 July 2026 |
| Confirmed planetary systems | 4,725 (1,055 multi-planet) | 2 July 2026 |
| Additional candidates awaiting confirmation | 8,000+ | 2025–2026 |
| Estimated habitable-zone Earth-sized planets, Milky Way only | ≈ 11–40 billion | extrapolated |
| Projected discoveries from Roman Space Telescope | 100,000+ | mission projection, launch 30 Aug 2026 |
5.5 A few individually notable worlds
Amid a catalogue now numbering in the thousands, a handful of individual confirmed exoplanets have drawn sustained scientific attention precisely because of what they reveal about the boundaries of planetary formation and detection. The TRAPPIST-1 system, a red dwarf star hosting seven roughly Earth-sized planets, several within or near its habitable zone, remains one of the most intensively studied planetary systems beyond our own, including repeated targeted observation by the James Webb Space Telescope’s spectroscopic instruments. Proxima Centauri b, orbiting the nearest star to our Sun, is notable simply for its proximity, making it one of the few confirmed exoplanets that could plausibly be reached by a fast robotic probe within a human lifetime under proposed future propulsion concepts, even though no such mission currently exists. At the extremes of the confirmed catalogue, the least massive known exoplanet, informally named Draugr, is only about twice the mass of Earth’s Moon, while the most massive object still classified as a planet rather than a brown dwarf on the NASA Exoplanet Archive, HR 2562 b, is roughly thirty times the mass of Jupiter — a span illustrating just how wide the definitional boundary of ‘planet’ has had to stretch as the catalogue has grown. More recently, in 2026, astronomers identified a candidate super-Earth designated Gliese 3378b, considered potentially habitable and illustrative of the kind of nearby, well-characterized world that ongoing surveys continue to add to the catalogue on a near-weekly basis.
5.6 The Milky Way’s planetary population, reconsidered
It is worth being precise about what is and is not known regarding planets beyond the confirmed catalogue. Researchers are confident, based on the statistical patterns in confirmed detections combined with the demonstrated sensitivity limits of current surveys, that planets are extremely common companions to stars generally, likely outnumbering stars in absolute terms once smaller and more distant planets are accounted for. What remains genuinely uncertain is the precise occurrence rate broken down by planet size, orbital distance, and host star type — precisely the parameters the Roman Space Telescope and further Gaia data releases, discussed below, are designed to pin down more tightly. The habitable-zone extrapolation of 11 to 40 billion Earth-sized planets in the Milky Way, discussed above, should therefore be read as a plausible current estimate built on the best available occurrence-rate statistics for Sun-like and red dwarf stars specifically, not as a figure with the same evidentiary standing as the confirmed exoplanet count itself.
5.7 Comparing detection methods side by side
Because each exoplanet detection method carries a distinct observational bias, researchers routinely combine methods to build a fuller picture of a given planetary system, and the choice of method strongly shapes which kinds of planets a given survey is likely to find at all. The table below summarizes the four principal detection methods discussed in this article, alongside their characteristic strengths and biases.
| Method | What it measures | Best suited to detect | Characteristic bias |
|---|---|---|---|
| Transit photometry | Periodic dimming of starlight | Large planets in close, aligned orbits | Misses planets not aligned to transit from Earth’s view |
| Radial velocity | Doppler shift in host star’s spectrum | Massive planets close to their star | Less sensitive to small, distant planets |
| Gravitational microlensing | Temporary magnification of background starlight | Planets far from their star, including free-floating rogue planets | One-time events; cannot be re-observed |
| Direct imaging | Reflected or emitted light from the planet itself | Large, young, hot planets far from a bright host star | Fewer than 100 exoplanets imaged to date; requires extreme contrast |
| Astrometry (Gaia) | Star’s positional wobble on the sky | Massive planets in longer-period orbits | Requires years of precise, repeated measurement |
PART VI — WHY THE NUMBERS KEEP MOVING: METHOD, BIAS, AND MODEL
Reviewing the galaxy, star, and planet figures side by side, a pattern emerges that is worth stating explicitly: none of the headline numbers in this field are pure observations. Every one of them is an observation combined with a model, and the disagreements between competing estimates almost always trace back to a disagreement about the model rather than about the raw data itself.
6.1 Direct detection versus statistical inference
The clearest fault line runs between methods that count only what is directly detected — such as the New Horizons background-light measurement, or Gaia’s individually catalogued stars — and methods that infer an undetected population mathematically from an observed sample, such as the 2016 Conselice galaxy-mass-function approach or the mass-based Milky Way star estimates. Direct-detection methods tend to produce lower, more conservative figures with tighter, better-understood uncertainty; inference-based methods tend to produce higher figures whose accuracy depends entirely on the validity of the underlying model’s assumptions about the undetected population. Both approaches are legitimate scientific methods, and neither is inherently more ‘correct’ — but public communication of these figures has, historically, favoured whichever number is larger and more startling, without always making clear which methodological category it falls into.
6.2 Instrumental bias toward the bright and the near
Every telescope-based survey, regardless of method, is more sensitive to bright, large, close, and slow-moving objects than to faint, small, distant, or fast-changing ones. This bias shows up identically across all three counts discussed in this article: in galaxy surveys, it means small dwarf galaxies are systematically undercounted relative to bright spirals and ellipticals; in stellar surveys, it means faint red dwarfs are undercounted relative to bright, massive stars, exactly the correction van Dokkum’s 2010 work sought to apply; and in exoplanet surveys, it means large planets in short, close orbits are dramatically overrepresented in the confirmed catalogue relative to smaller planets in longer, more distant orbits, a bias every serious estimate in this field explicitly acknowledges.
6.3 Revisions rarely settle the underlying disagreement
It is tempting to read each new study covered in this article — the 2016 Conselice paper, the 2021–2025 New Horizons analysis, the 2024 Chworowsky reinterpretation of Webb’s brightest early galaxies — as the final word that supersedes what came before. In practice, none of them has fully displaced its predecessors from the active literature; researchers in 2026 can and do cite the two-trillion-galaxy figure, the several-hundred-billion figure, and various points in between, depending on which methodological assumptions they consider most defensible for their particular purpose. This is a healthy, ordinary feature of an active research field working at the edge of what current instruments can measure, not a sign of disarray, but it is also why any single figure quoted for ‘the number of galaxies in the universe’ should be understood as one credible estimate among several, rather than a settled fact.
[A WORKING PRINCIPLE]
When a cosmic count is quoted without a method attached, treat it as provisional. When it is quoted with a method — direct background-light measurement, mass-function modelling, individually confirmed catalogue entries — that method tells you more about the number’s reliability and likely bias than the number itself does.
6.4 A comparative view across all three counts
Placing the galaxy, star, and planet debates side by side makes the underlying pattern easier to see than examining any one of them in isolation. In every case, the most conservative, direct-detection-based figure is roughly one to three orders of magnitude smaller than the most expansive, model-based figure quoted for the same quantity, and in every case the gap between them is attributable to a specific, named methodological choice rather than to disagreement over raw data. The table below summarizes this pattern across the three counts discussed in this article.
| Quantity | Conservative / direct estimate | Expansive / model-based estimate | Primary source of the gap |
|---|---|---|---|
| Galaxies (observable universe) | ≈ hundreds of billions | ≈ 2 trillion | Background-light measurement vs. mass-function inference |
| Stars (observable universe) | ≈ 10²² | ≈ 10²⁴ | Galaxy-count uncertainty compounded with red-dwarf abundance |
| Habitable-zone planets (Milky Way only) | ≈ 11 billion | ≈ 40 billion | Whether red dwarf hosts are included alongside Sun-like stars |
6.5 The pace of publication itself is part of the story
One further methodological point deserves mention: a meaningful share of the Webb-era findings discussed throughout this article, particularly in Part III, are explicitly flagged by NASA’s own science communications as data still in progress, ahead of formal peer review. This is a deliberate and increasingly common practice in observational astrophysics, where the scientific and public value of releasing preliminary findings quickly is judged to outweigh the cost of occasionally having to revise or retract an early interpretation once peer review is complete. Readers encountering the very latest Webb findings — including some described in this article — should understand that a small fraction of them may be refined or superseded by the time formal publication occurs, which is simply the ordinary, healthy operation of a fast-moving observational field rather than a reason for skepticism about the underlying data.
6.6 An international, collaborative undertaking
A final methodological point worth noting is how thoroughly international this entire research effort is, which itself has bearing on how confidently its conclusions can be held. The James Webb Space Telescope is an international program led by NASA in partnership with the European Space Agency and the Canadian Space Agency, drawing on thousands of scientists, engineers, and technicians from fourteen countries. Gaia is an ESA mission; New Horizons and TESS are NASA missions with international science teams; the Nancy Grace Roman Space Telescope, though NASA-led, will similarly draw on a broad international user community once operational. This breadth matters because it means the competing estimates discussed throughout this article are not the product of a single national research programme with a single institutional incentive to favour one figure over another, but the result of genuinely independent teams, often working with entirely different instruments and funding sources, arriving at different answers through different methods. That kind of independent replication and cross-checking — even when it produces disagreement rather than consensus, as it currently does for the galaxy count — is one of the strongest forms of evidence that the scientific process behind these numbers is working as intended, rather than converging on a single figure prematurely for reasons of convenience.
PART VII — IMPLICATIONS: OLBERS’ PARADOX, HABITABILITY, AND WHAT COMES NEXT
7.1 Why the sky is dark at night
Olbers’ paradox, first formulated in the early nineteenth century by the German astronomer Heinrich Wilhelm Olbers, asks a deceptively simple question: if the universe contains an enormous, possibly infinite, number of stars distributed roughly evenly through an infinite or near-infinite space, why is the night sky dark rather than uniformly bright with starlight from every direction? The galaxy-count research covered in this article contributes two complementary pieces to the modern resolution of that paradox. First, the universe is not infinitely old — at roughly 13.8 billion years old, light from the most distant possible sources has simply not had time to reach Earth from beyond the observable universe, regardless of how many stars might exist there. Second, and more subtly, the Conselice team’s 2016 work argued that even within the observable universe, the light from the vast number of faint, distant galaxies implied by their model is so redshifted and diluted by cosmic expansion that it never becomes visible as background brightness, even though, in their framing, virtually every patch of sky does technically contain part of a galaxy. The subsequent New Horizons measurement, which found less background light than the two-trillion-galaxy model predicted, can be read as independent, direct evidence supporting the same broad conclusion — that the night sky’s darkness is fully consistent with a finite-age, expanding universe — even as it disputes the specific galaxy count Conselice’s team used to get there.
7.2 The search for habitable worlds
The steady rise of the confirmed exoplanet catalogue — from a single confirmed world in 1992 to 6,316 as of July 2026 — has shifted the central question in planetary science from whether other planetary systems exist at all to what fraction of them might resemble our own closely enough to support life. The habitable-zone extrapolations discussed in Part V (on the order of 11 to 40 billion potentially habitable Earth-sized planets in the Milky Way alone) remain estimates rather than confirmed counts, precisely because current detection methods are still biased toward planets that are large, close to their star, or otherwise easier to detect than a true Earth analogue in a Sun-like star’s habitable zone. Missions such as the Roman Space Telescope and continued TESS operations are expected to narrow this gap over the coming years by detecting smaller, more distant, and more Earth-like worlds than earlier instruments could reliably confirm.
7.3 What is likely to change these numbers next
Several specific, dated developments are likely to move the figures in this article again before the end of the decade. The Nancy Grace Roman Space Telescope’s 30 August 2026 launch is expected to expand both the confirmed exoplanet catalogue and, through its wide-field surveys, the census of faint galaxies at various cosmic epochs. ESA’s Gaia mission is expected to release a substantial new exoplanet data set in 2026 using astrometric detection, a method with different biases than transit or radial-velocity detection and therefore likely to reveal a different slice of the true planet population. And the ongoing tension between the Conselice-era model-based galaxy count and the New Horizons-era direct measurement is explicitly framed, by the researchers themselves, as a question for continued James Webb deep-field surveys to help resolve — meaning the next credible revision to the headline galaxy-count figure is likely to come from exactly the kind of Webb ultra-deep observations already discussed in Part III, rather than from an entirely new instrument.
For a reader more accustomed to evaluating markets, portfolios, and institutional governance than astrophysics, one transferable lesson from this research is methodological rather than astronomical: every figure in this article is only as trustworthy as the assumptions feeding into it, and the widest, most quoted number is not automatically the most defensible one. This is a familiar discipline in rigorous investment analysis and institutional diagnostics alike — a headline valuation, growth projection, or compliance figure is only as sound as the model producing it, and a practitioner who understands the assumptions behind a number is better positioned than one who simply repeats it. The astrophysics community’s willingness to publish, debate, and revise competing galaxy-count models in the open, rather than converging prematurely on a false consensus, is arguably a model of methodological transparency worth noting well beyond the field of cosmology itself.
7.4 A closing perspective on scale
It is worth ending this part on a note of proportion rather than precision. Whether the observable universe contains two hundred billion galaxies, two trillion, or some figure in between, and whether it contains ten sextillion stars or one septillion, the practical implication for how we understand our own place in the cosmos is largely the same: the Earth, the Sun, and the entire solar system discussed in Part VIII occupy a vanishingly small fraction of a structure so vast that even a tenfold or hundredfold uncertainty in the final tally does not meaningfully change the qualitative picture. The research surveyed in this article is valuable not because it will eventually converge on a single, memorizable figure, but because the process of pursuing that figure — building better telescopes, questioning old assumptions, and following the data even when it contradicts a popular prior estimate — is itself one of the more instructive examples available of how careful, adversarial, and ultimately self-correcting science operates at the largest scales imaginable.
PART VIII — OUR SOLAR SYSTEM IN CONTEXT
It is easy, in an article devoted to trillions of galaxies and sextillions of stars, to lose sight of how well characterized our own solar system is by comparison, and how useful that contrast is for understanding what ‘confirmed’ actually means at different scales. Every planet, dwarf planet, and major moon in our own solar system has been directly imaged, in most cases visited by at least one robotic spacecraft, and had its mass, composition, and orbit measured to a precision that no exoplanet — however well studied — currently approaches. This is not a coincidence of effort; it is a direct consequence of distance. Our solar system’s planets are, at most, a few light-hours from Earth, while even the nearest confirmed exoplanets are several light-years away, a gap of roughly four to five orders of magnitude that explains why in-situ exploration of exoplanets remains entirely outside current or near-future technological reach.
8.1 A moving count even close to home
Even within our own solar system, the count of known bodies is not static. As recently as January 2026, a previously unknown moon orbiting Uranus was identified using James Webb Space Telescope observations, expanding Uranus’s known satellite family to 29 — a reminder that ‘complete’ knowledge of even our own immediate cosmic neighbourhood remains aspirational rather than achieved. Similarly, ongoing monitoring of small solar system bodies, including near-Earth asteroids such as 2024 YR4, continues to refine both the total count and the risk assessment of objects sharing our solar system, using the same instruments — Webb prominent among them — that are simultaneously being used to probe the most distant galaxies discussed in Part III.
8.2 Interstellar visitors: a new category entirely
A genuinely new category of solar system object has emerged only in the past decade: interstellar objects, bodies that originated around another star entirely and are merely passing through our solar system on unbound trajectories. Webb has recently conducted chemical analysis of one such interstellar comet, designated 3I/ATLAS, collecting mid-infrared spectroscopic data during a close approach. Objects like this are a useful bridge between the solar-system-scale and exoplanet-scale research described elsewhere in this article: they represent physical material from another star system, arriving close enough for direct spectroscopic study, at a level of detail that a confirmed exoplanet light-years away could never permit. As detection surveys improve, the rate of interstellar object discovery is expected to increase, offering an increasingly direct, sample-based complement to the purely remote, light-based methods used to characterize exoplanets proper.
8.3 A note on ground-based infrastructure: the view from Africa
While this article has focused primarily on space-based instruments — Hubble, Webb, Gaia, New Horizons, TESS, and Roman — a substantial share of the observational infrastructure underpinning modern galaxy and star surveys is ground-based, and South Africa hosts one of the most significant such facilities in the Southern Hemisphere. The Square Kilometre Array (SKA) project, with its South African component (SKA-Mid) sited in the Northern Cape alongside the pathfinder MeerKAT radio telescope array, is designed to conduct radio-wavelength surveys of the sky at a sensitivity and speed that complement the optical and infrared surveys discussed throughout this article. Radio astronomy operates on different physical principles than the visible-light and infrared methods used by Hubble and Webb, detecting emission from neutral hydrogen gas and synchrotron radiation rather than starlight directly, which makes it particularly well suited to tracing the large-scale distribution of galaxies and the neutral hydrogen fog relevant to the cosmic reionization era discussed in Part III. For a South African-based reader, it is worth noting that the same broad category of ‘how many galaxies exist’ question addressed throughout this article is, in part, being pursued using instruments built and operated on South African soil, placing the country’s scientific and technology infrastructure directly within the global effort described here.
8.4 The comparative confidence table
The table below places solar system knowledge, exoplanet knowledge, and the galaxy- and star-scale estimates discussed earlier in this article on a single comparative scale, ordered from most to least directly confirmed. It is intended as a summary reference for the epistemic status of every major figure discussed across this article, rather than as a new independent claim.
| Scale | Typical distance | Confirmation method | Epistemic status |
|---|---|---|---|
| Solar system planets/moons | Light-minutes to light-hours | Direct imaging, spacecraft visitation | Fully confirmed, individually characterized |
| Nearby interstellar objects | Light-minutes (during passage) | Direct imaging and spectroscopy | Fully confirmed, individually characterized |
| Confirmed exoplanets | Light-years to hundreds of light-years | Transit, radial velocity, microlensing, imaging | Confirmed existence; limited characterization |
| Local Group galaxies | Thousands to millions of light-years | Direct imaging | Confirmed existence; count still rising |
| Distant galaxies (observable universe) | Millions to billions of light-years | Deep-field imaging + statistical modelling | Estimated; actively disputed total |
| Total stars (observable universe) | N/A (derived) | Compounded galaxy and mass estimates | Estimated; wide uncertainty range |
CONCLUSION
The honest headline of this article is not a single number, but a map of how confidently different numbers can be held. The exoplanet count — 6,316 confirmed worlds as of 2 July 2026 — is the most solid figure discussed here, because it is a running, individually verified catalogue rather than an extrapolation, even though the far larger population of planets it implies remains an estimate. The galaxy count is the most actively contested, with credible, peer-reviewed research currently supporting figures that differ by close to an order of magnitude — a few hundred billion versus roughly two trillion — depending on whether the method used is direct background-light measurement or model-based inference from galaxy mass functions. The star count sits in between: derived entirely from the galaxy count combined with assumptions about stellar populations per galaxy, it inherits every uncertainty from the galaxy debate and adds its own, particularly around the true abundance of faint red dwarf stars first flagged by research in 2010 and still not fully resolved.
None of this uncertainty reflects a field in disarray. It reflects, instead, a field working at the genuine edge of what current instruments, spacecraft, and statistical methods can measure — and doing so with a level of rigour, transparency about assumptions, and willingness to revise conclusions in public that few other domains of inquiry can match. The James Webb Space Telescope, New Horizons, Gaia, TESS, and the incoming Roman Space Telescope each approach the same underlying questions from a genuinely different angle, and the coming years are likely to bring these competing lines of evidence closer together — or, just as plausibly, to reveal further surprises of the kind that turned ‘impossible’ early galaxies into one of the most productive puzzles in recent astrophysics. For now, the most defensible position is not to memorize a single figure for the number of galaxies, stars, or planets in the universe, but to understand the method behind whichever figure is being quoted, and to hold it with the same provisional confidence the researchers who produced it do.
The appendices that follow — a set of frequently asked questions and a glossary of the technical terms used throughout this article — are intended as a standing reference for revisiting any of these figures in the future, since it is a near-certainty that at least one of them will be revised again before this decade closes.
APPENDIX — FREQUENTLY ASKED QUESTIONS
Q: So which galaxy number is actually correct — two trillion, or a few hundred billion?
Both remain in active use in the peer-reviewed literature as of 2026, and this article deliberately avoids picking a winner, because neither has been definitively falsified. The two-trillion figure rests on model-based inference from galaxy mass functions (Conselice et al., 2016); the lower figure rests on a direct measurement of the sky’s background darkness from the New Horizons spacecraft (Lauer, Postman et al., analysis through 2025). The honest answer is that the disagreement is unresolved, and further James Webb deep-field data is the most likely source of a future reconciliation.
Q: Has anyone actually counted a galaxy’s stars one at a time?
No galaxy, including the Milky Way, has ever had its full stellar population counted individually. The closest approach is ESA’s Gaia mission, which has individually catalogued nearly two billion Milky Way stars as of 2026 — an enormous technical achievement, but still only about one percent of the galaxy’s total estimated stellar population.
Q: Why does NASA quote a number as high as one septillion stars?
NASA’s public science communications describe up to one septillion (10²⁴) as an upper-bound estimate for the observable universe, consistent with using a higher galaxy-count figure and an average stars-per-galaxy assumption that accounts for the abundance of faint red dwarfs highlighted by 2010 research. Other credible published estimates land closer to 10²², illustrating the roughly hundredfold spread discussed throughout Part IV.
Q: Are there really more stars than grains of sand on Earth?
Under the higher end of published estimates (upwards of 10²³–10²⁴ stars), yes — this comparison, often attributed loosely to popular science writing, is broadly consistent with independent estimates of the total grains of sand on Earth’s beaches and deserts, which fall in a comparable but somewhat lower order of magnitude. The comparison should be read as an illustration of scale rather than a precise equivalence, given the uncertainty ranges on both sides of it.
Q: How many of the 6,316 confirmed exoplanets could support life?
None has been confirmed to support life, and confirming habitability — as opposed to merely orbiting within a habitable zone — requires atmospheric characterization well beyond what most current instruments can deliver for planets light-years away. A number of planets, including several in the TRAPPIST-1 system and the 2026 candidate Gliese 3378b, are considered potentially habitable based on size and orbital distance alone, which is a necessary but far from sufficient condition for actual habitability.
Q: Will the Roman Space Telescope settle the galaxy-count debate?
Not directly — Roman is primarily designed for wide-field surveys optimized for dark energy research and exoplanet discovery via microlensing, rather than the ultra-deep, narrow-field imaging that drives the galaxy-count debate specifically. It is expected to meaningfully expand the exoplanet catalogue, however, and its wide-field data will still contribute useful context to galaxy population studies even if it does not resolve the Conselice-versus-Lauer/Postman disagreement on its own.
Q: Is the universe actually infinite?
This remains genuinely unknown. Current measurements are consistent with a universe that is spatially flat, which is also consistent with either an infinite universe or a finite one simply too large for its curvature to be detectable with current instruments. This article’s figures all refer strictly to the observable universe — the bounded region from which light has had time to reach us — precisely because the total universe’s size, whether finite or infinite, cannot currently be measured.
Q: Why do popular articles still repeat the 100–200 billion galaxy figure?
Largely a matter of information lag rather than active disagreement: the pre-2016 figure was taught for two decades and remains embedded in a great deal of still-circulating educational material, museum signage, and casual references, even though the research community has moved through at least two subsequent major revisions since then. Part II’s timeline is intended, in part, to make that revision history explicit for exactly this reason.
Q: What is the single most important takeaway for a non-specialist reader?
That a cosmic figure’s reliability depends far more on the method behind it than on how large or how frequently repeated the figure is. A direct measurement from an instrument like New Horizons or Gaia, even when it produces a smaller, less dramatic number, generally deserves more confidence than a model-based extrapolation, however widely that extrapolation has been repeated in classrooms, documentaries, or casual conversation. Reading any cosmic statistic with that distinction in mind is the most durable lesson this article has to offer.
APPENDIX — GLOSSARY OF KEY TERMS
Observable universe
The finite spherical region of space from which light has had time to reach Earth since the Big Bang, roughly 46.5 billion light-years in radius. Distinct from the universe as a whole, which may be far larger or infinite.
Redshift
The stretching of light to longer, redder wavelengths as it travels through expanding space; used to measure how far away, and how far back in time, a distant galaxy is being observed.
Deep field / ultra-deep field
A very long-exposure image of a small patch of sky, designed to detect the faintest, most distant objects possible; the primary method behind Hubble and Webb’s early-universe galaxy surveys.
Galaxy mass function
A statistical model describing how many galaxies of a given mass exist at a given cosmic epoch; used to infer the population of galaxies too faint to detect directly.
Zodiacal light
Faint sunlight scattered by interplanetary dust within our own solar system; it contaminates Earth-based measurements of the sky’s true background darkness, which is why the New Horizons spacecraft’s distance from the Sun was scientifically valuable.
Cosmic reionization
The epoch, several hundred million years after the Big Bang, during which ultraviolet light from the first stars and galaxies ionized the universe’s neutral hydrogen gas, allowing light to travel freely through space.
Transit method
An exoplanet detection technique that measures the small, periodic dimming of a star’s brightness as a planet passes in front of it from Earth’s point of view.
Radial velocity / Doppler method
An exoplanet detection technique that measures the small gravitational wobble a planet induces in its host star’s motion, detected as a shift in the star’s light spectrum.
Astrometry
The precise measurement of a star’s position and motion in the sky; a planet’s gravity causes a detectable wobble in this position, forming the basis of Gaia’s planet-detection method.
Habitable zone
The range of orbital distances from a star within which a planet could plausibly maintain liquid water on its surface, given a suitable atmosphere.
Occurrence rate
The statistically estimated fraction of stars of a given type that host a planet of a given size and orbital range; used to extrapolate from confirmed exoplanets to the total inferred planet population.
Olbers’ paradox
The question of why the night sky is dark rather than uniformly bright, given an enormous or infinite number of stars; resolved by the universe’s finite age and the redshifting of distant light rather than by a genuine scarcity of stars.
Local Group
The cluster of galaxies gravitationally bound to the Milky Way and Andromeda, now known to include more than 200 member galaxies, most of them small dwarf systems.
Brown dwarf
An object intermediate in mass between a planet and a star, too massive to be classified as a planet under most conventions but insufficiently massive to sustain the hydrogen fusion that defines a true star.
Galaxy mergers
Gravitational collisions and combinations between galaxies over cosmic time, understood to have progressively reduced the total galaxy count while increasing the average mass of surviving galaxies.
Interstellar object
A body, such as an asteroid or comet, that originated in another star system and passes through our solar system on an unbound trajectory, offering a rare opportunity for direct, close-range study of extrasolar material.
SOURCE NOTES
This article draws on peer-reviewed research and primary reporting current as of July 2026, including: Conselice et al. (2016), The Astrophysical Journal, on galaxy mass-function modelling; Lauer, Postman, and colleagues’ New Horizons-based background-light analysis (NSF’s NOIRLab / Space Telescope Science Institute, published through 2025); Chworowsky et al. (2024), The Astronomical Journal, on black-hole-driven brightness in early Webb-observed galaxies; Wold et al. (2025) and the UNCOVER survey team on low-mass starburst galaxies and cosmic reionization; van Dokkum (2010, Yale University) on red dwarf abundance in elliptical galaxies; the NASA Exoplanet Archive (operated by Caltech/IPAC for NASA’s Exoplanet Exploration Program), for the confirmed exoplanet count as of 2 July 2026; and public science communications from NASA, ESA, and NASA’s Jet Propulsion Laboratory on the Gaia, TESS, and Nancy Grace Roman Space Telescope missions.
Additional supporting material referenced throughout this article includes: the 2018 gamma-ray-based star formation history published in Science; the 2008 Sloan Digital Sky Survey stellar catalogue results; NASA science communications on the JADES survey and the galaxy JADES-GS-z13-1; reporting on the ‘Big Wheel’ spiral galaxy discovery (2025) and the University of Missouri’s 2025 study of anomalous Webb-detected galaxies; and current status updates on the Square Kilometre Array and MeerKAT radio telescope infrastructure in South Africa’s Northern Cape. Figures for confirmed exoplanets, planetary systems, and multi-planet systems reflect the NASA Exoplanet Archive and English Wikipedia’s exoplanet summary as of 2 July 2026, and should be understood to continue increasing on a rolling basis as new discoveries are confirmed.






Be First to Comment